RAPP and the Vanier Institute have published a compilation of caregiving infographics.
Type: Infographics and factsheets
Infographic: Economic Contributions of Employed Caregivers
Research on Aging, Policies and Practice has published new data on the economic contributions of caregivers.
Infographic: Supporting Employed Caregivers Makes Good Business Sense

Research on Aging, Policies and Practice provides new data on the “business case” for supporting employed caregivers
Infographic: Family Caregiving and Flexible Work Arrangements
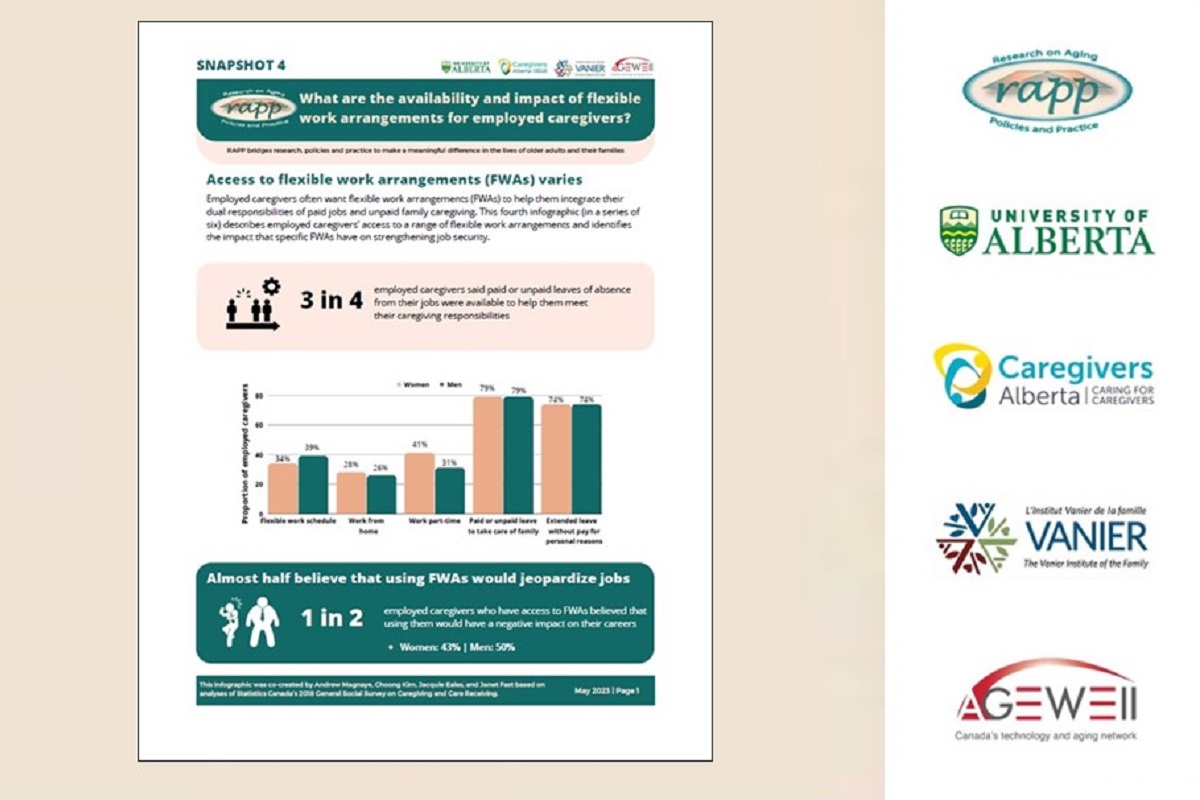
Research on Aging, Policies and Practice has published new data on the availability and impact of workplace flexibility.
Infographic: How Does Caregiving Impact Paid Work for Employed Women and Men?

Research on Aging, Policies and Practice has published new data on how caregiving affects employed Canadians.
Infographic: Who Are Employed Caregivers in Canada?

Research on Aging, Policies and Practice has published new data on working caregivers.
National Caregiver Day: Supporting Working Caregivers

Fast facts on family care for National Caregiver Day 2022.
Infographic: Value of Family Caregiving in Canada
Researchers estimate the economic value of caregiving in Canada at $97B per year.
A Snapshot of Family Caregiving and Work in Canada
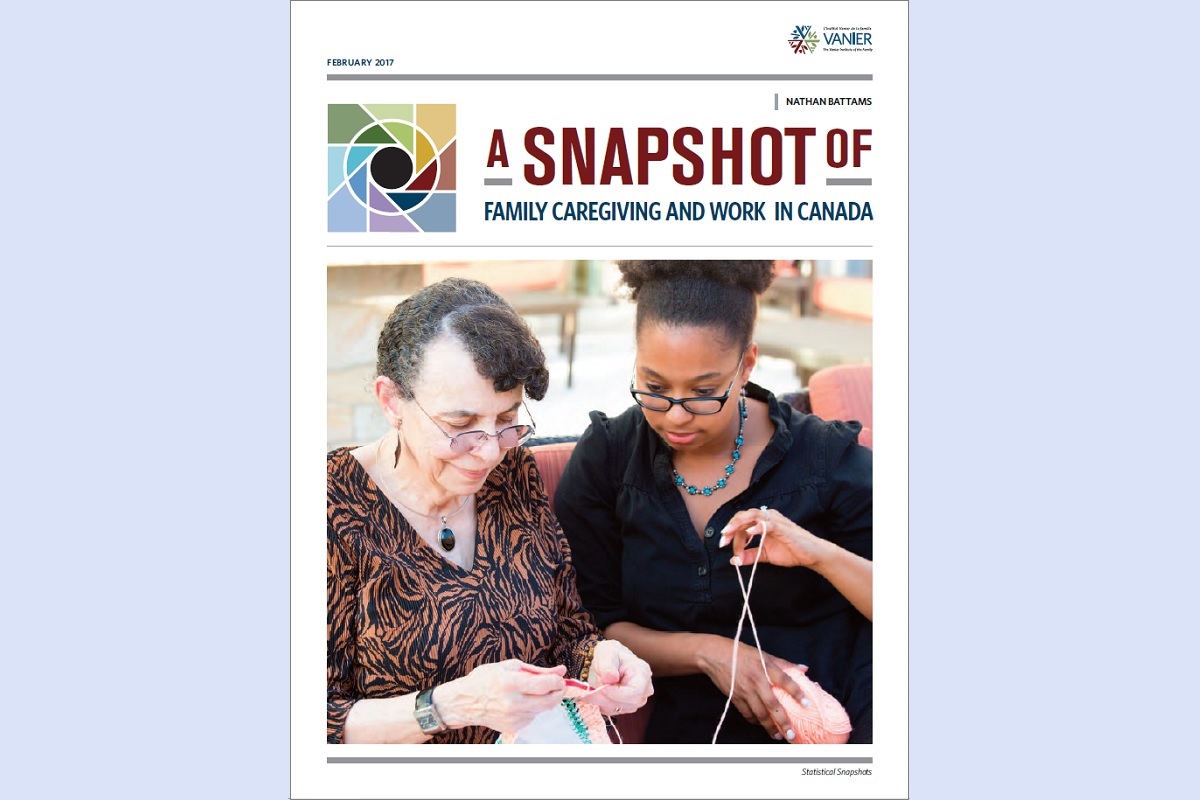
At some point in our lives, there is a high likelihood that each of us will provide care to someone we know – and receive care ourselves. Family members are typically the first to step up to provide, manage and sometimes pay for this care.
Families are highly adaptable and most of the time people find ways to manage their multiple work and family responsibilities, obligations and commitments. However, juggling work and care can sometimes involve a great deal of time, energy and financial resources, and employers can play an important role in facilitating this care through accommodation, innovation and flexibility.
In A Snapshot of Family Caregiving and Work in Canada, we explore some of the family realities and trends that shape the “landscape of care” across the country. This resource highlights how our family, care and work responsibilities intersect, interact and have an impact on each other.
Highlights include:
- 28% of Canadians (8.1M) report having provided care to a family member or friend with a long-term health condition, disability or aging need in the past year.
- Three-quarters of family caregivers (6.1M) were employed at the time, accounting for 35% of ALL employed Canadians.
- Most (83%) surveyed caregivers say their experience was positive, and 95% say they are effectively coping with their caregiving responsibilities.
- 44% of employed caregivers report having missed an average 8–9 days of work in the past 12 months because of their care responsibilities.
- More than one-third of young carers (36%) arrived to work late, left early or took time off due to their caregiving responsibilities.
- Employers across Canada lose an estimated $5.5 billion annually in lost productivity due to caregiving-related absenteeism.
- Research shows that caregiving provides a variety of benefits to caregivers, including a sense of personal growth, increased meaning and purpose, strengthened family relationships, increased empathy and skill development.
Reconciling care and work requires understanding, respect and recognition from employers that sometimes an employee’s family circumstances need focused attention. Research shows that family caregivers and their employers benefit from policies that are inclusive, flexible and responsive, and when employees have a clear understanding of the process for handling individual requests for accommodation and customizing work arrangements.
For nearly all Canadians, caregiving is inevitable at some point over the course of their lives. Care is not always predictable and does not always arise outside working hours. Open communication and creative approaches to harmonizing work and care in a flexible manner benefits employees, employers, the economy and society.
Download A Snapshot of Family Caregiving and Work in Canada from the Vanier Institute of the Family.
Modern Family Finances: Military and Veteran Families in Canada

Canada’s military and Veteran families are diverse, resilient and strong, and they make significant contributions to society as they manage their work and family responsibilities.
Research shows that military and Veteran families share many of the same financial stressors as civilian families, including changes in family income and/or employment, disruptions or unexpected expenditures (e.g. out-of-pocket medical expenses, foreclosures) and major life events (e.g. marriage, divorce, childbirth).
However, employment with the Canadian Armed Forces (CAF) brings with it the realities of military life, including a greater degree of mobility, separation and risk. These factors contribute to the uniqueness of military family life, and they can have a positive impact on family finances (e.g. benefits, relatively stable full-time employment and income), as well as negative impacts (e.g. costs associated with relocation and deployments, career sacrifices for partners of serving CAF members, difficulties for Veterans transitioning to civilian life and the civilian workforce).
This edition of Modern Family Finances explores military and Veteran families in Canada, focusing on the unique realities and experiences that impact their income and expenditures, savings and debt, and wealth and net worth.
Highlights include:
- In 2018, more than four in 10 CAF members (43%) reported having some financial problems, with 10% citing this as the most significant problem they faced in the past year.
- In 2018, among CAF members who had been posted to a new location, nearly six in 10 (57%) said that their financial situation had worsened, with a change in the cost of living cited as the main reason.
- In 2016, the Veteran population in Canada was less likely to be in the paid labour force (28%) than civilians (20%).
- In transitioning to civilian life, research shows that female Veterans experience a significantly higher average decline in income (a decline of 21% between their pre-release year and the first three years afterwards) than male Veterans (a decline of 1%).
- Research shows that in the workplace, Veterans are nearly three times more likely than the general working population to report having long-term physical or mental health conditions or a health-related activity limitation at work (35% and 13%, respectively).
Download Modern Family Finances: Military and Veteran Families in Canada
Research by Gaby Novoa and Nathan Battams
Source information available on the PDF version of this resource.
Facts and Stats: Maternal Mental Health in Canada

Download Facts and Stats: Maternal Mental Health in Canada
Maternal health and well-being is an important public health issue, of which mental health is a key component. Data shows that while most new and expectant mothers report good mental health and high life satisfaction, experiences of postpartum depression (PPD) and anxiety are common in Canada.
Research shows that PPD and poor mental health are detrimental to the well-being of mothers and can, if left untreated, adversely affect infant development (e.g. low birth weight, preterm birth, increased risk of mental health problems in the child later in life), as well as leave partners and other family members (including fathers, who are at an elevated risk for depression or anxiety) feeling overwhelmed.
Fortunately, multiple effective and well-researched treatment options are available to help women recover, and research shows that social and emotional support from partners and other family members throughout the perinatal period can reduce the likelihood of PPD and emotional distress for both mothers and newborns.
This edition of Facts and Stats explores the mental health of new and expectant mothers in Canada, with a focus on family well-being.
Highlights include:
- In 2018–2019, most (60%) mothers who recently gave birth rated their mental health as excellent or very good, while nearly one-quarter (23%) reported feelings consistent with PPD or an anxiety disorder.
- In 2018–2019, 30% of mothers who recently gave birth under the age of 25 reported feelings consistent with PPD or an anxiety disorder, compared with 23% among those 25 or older.
- In 2018–2019, nearly one-third (32%) of recent mothers who reported feelings consistent with PPD or an anxiety disorder said they have received treatment for their emotions or mental health since the birth of their child.
- Maternal mental health is affected by socio-economic status, with research showing higher rates of PPD and depressive symptoms among mothers from marginalized groups, including people living with disabilities; recent migrant mothers, asylum-seekers and refugees; and mothers self-identifying as Black or First Nations.
- Mothers with adverse life experiences are also at a higher risk of developing mental disorders, such as those living in food-insecure households or in emergency or conflict situations, and those who have experienced violence (domestic, sexual or gender-based) or natural disasters.
Download Facts and Stats: Maternal Mental Health in Canada
This resource will continue to be updated as new research and data emerges (previous versions will be continually available on our fact sheets page).
Source information available on the PDF version of this resource.
Facts and Stats: Working Seniors in Canada (2019 Update)

A growing number of seniors in Canada today are choosing to remain in – or return to – the paid labour market to manage their multiple financial responsibilities and, for some, to provide support to younger generations. As seniors and their families adapt their financial management strategies, expectations and aspirations in response to this ever-changing environment, they in turn are reshaping workplaces, Canada’s workforce, modern retirement and the economy at large.
To explore the relationship between seniors and family finances, we’ve created a fact sheet that gathers statistics from a variety of sources about seniors, their economic well-being and their evolving relationship with the paid labour market.
Highlights include:
- According to the 2016 Census, 1 in 5 seniors in Canada worked at some point in 2015, 30% of whom worked full-year and full-time.
- In 2016, the average retirement age in Canada was 63.8 years – a slow but steady increase from a low of 60.9 years in 1998.
- In 2017, surveyed Canadians aged 60 and older who worked or wanted to work were nearly split on the question of whether it was “out of necessity” (49%) or “out of choice” (51%).
- Nearly 3 in 10 surveyed working seniors surveyed in 2018 (28%) reported that they provide financial support to their children.
Download Facts and Stats: Working Seniors in Canada (2019 Update).
In Focus 2019: Food Insecurity in Canada

Food insecurity in Canada is an issue deeply intertwined with the health and economic well-being of families. While there is no single cause for food insecurity, research shows that both economic insecurity and geographical isolation (in particular, the higher food costs in Northern communities resulting from a lack of year-round rail, road or marine access) contribute to families not having access to sufficient, safe and nutritious food to meet their dietary needs for a healthy life.1
Food-insecure families are more likely to experience adverse effects to their health and well-being, which include restricted mobility and chronic conditions, poor mental health and mental distress.2 This impacts individuals, families and communities, and incurs considerable costs on the health care system – it’s a matter of family well-being and public health.
In recognition of Hunger Action Month, which raises awareness on national, provincial and local levels about hunger in Canada, this edition of In Focus highlights data on food insecurity across the country.
Many Canadians – including children and youth – continue to experience food insecurity
- In 2018, 1 in 4 children and youth under 18 (23%) say they go to bed or school hungry at least sometimes because there is not enough food at home.3
- In 2018, children and youth under 18 accounted for 20% of the population in Canada but 35% of those who accessed food banks in March of that year.4
- In 2015–2016, approximately 16% of households in reporting provinces and territories across Canada5 experienced food insecurity.6
Northern populations and marginalized groups experience disproportionately high rates of food insecurity
- In March 2018, six in 10 people who accessed food banks (59%) were on social assistance or disability-related supports.7
- In 2015–2016, more than half (51%) of households in Nunavut were food insecure – by far the highest rate in Canada and more than three times the average rate of the remaining reporting provinces and territories (11%).8
- In 2015–2016, nearly three-quarters of the children in Nunavut (72%) and one-third of the children in the Northwest Territories (32%) lived in food-insecure households, compared with 16% to 23% among the remaining reporting provinces and territories.9
- Despite the launch of Nutrition North – a food retail subsidy designed to improve food access and affordability in isolated communities – annual rates of food insecurity actually increased in Nunavut between pre-implementation (33% to 40% between 2007 and 2010) and the years following implementation of the program (46% to 56% between 2013 and 2016).10, 11
- Research from 2014 showed that rates of food insecurity among Black people (29%) and Indigenous people (26%) were more than twice as high as the national average (12%).
Data gaps leave us without a clear picture of the prevalence and impact of food insecurity among diverse groups
- The Canadian Community Health Survey (the main source for information on food insecurity in Canada) doesn’t collect data from First Nations reserves, resulting in approximately half of all status First Nations peoples (approximately 300,000) being left out of the picture, and thus underestimating the prevalence of food insecurity.12
- Other diverse groups, including full-time members of the Canadian Armed Forces, people living in institutions and the 235,000 Canadians who experience homelessness in any given year are not represented in national food insecurity data (despite the latter being more vulnerable to food insecurity than the general population).13
Notes
- Paula Arriagada, “Food Insecurity Among Inuit Living in Inuit Nunangat,” Insights on Canadian Society, Statistics Canada catalogue no. 75-006-X (February 1, 2017). Link: https://bit.ly/2maW9oN.
- Ibid.
- UNICEF Canada, Where Does Canada Stand? The Canadian Index of Child and Youth Well-being: 2019 Baseline Report (September 3, 2019). Link: https://bit.ly/2kpOeDv.
- Food Banks Canada, Hunger Count 2018 (February 5, 2018).
- Newfoundland and Labrador, Ontario and Yukon opted out of food insecurity measurement in 2015–2016.
- PROOF Food Insecurity Policy Research, Latest Household Food Insecurity Data Now Available (June 25, 2018).
- Food Banks Canada, 2018.
- PROOF Food Insecurity Policy Research, 2018.
- Ibid.
- Research suggests this may be the result of the program’s focus on perishable, nutritious foods, as well as the exclusion of most non-perishable foods and all non-food items from the subsidy.
- Andrée-Anne Fafard St-Germain, Tracey Galloway and Valerie Tarasuk, “Food Insecurity in Nunavut Following the Introduction of Nutrition North Canada,” Canadian Medical Association Journal, 191:20 (May 21, 2019). Link: https://bit.ly/2m5FJhb.
- PROOF Food Insecurity Policy Research, Household Food Insecurity in Canada: A Guide to Measurement and Interpretation (November 2018). Link: https://bit.ly/2kAs2qd.
- Ibid.
Facts and Stats: House, Home and Family Finances (2019 Update)

Home is at the heart of family life, the primary setting in which our family relationships are built and nurtured throughout our lives, and the stage on which so many of our family memories are created.
Our relationships with our homes are shaped by the evolving social, economic and cultural contexts in which we live, and where we choose to call home can change over time as we adapt our expectations and aspirations to these ever-changing environments.
To further explore the relationship between families and their homes, we’ve updated our House and Home in Canada fact sheet with new data, this time with a focus on family finances and home.
Highlights include:
- In 2016, median monthly shelter costs in Canada were $1,130 for owned households and $910 for rented households.
- In 2016, 16% of owned and 40% of rented households in Canada had monthly shelter costs considered not affordable.
- According to recent estimates, it now takes 13 years for a typical person aged 25 to 34 to save a 20% down payment on an average-priced home in Canada, compared with 5 years in 1976.
- Recent estimates show that a typical person would have to earn at least $22.40 per hour to be able to afford renting an average-priced two-bedroom apartment in Canada.
Download the House, Home and Family Finances (2019 Update) fact sheet.
This resource will continue to be updated as new research and data emerges (previous versions will be continually available on our fact sheets page).
Published on August 15, 2019
In Focus 2019: Fathers “Making It Work”

June 16, 2019 is Father’s Day, a time to recognize and celebrate dads and the diverse contributions they make to family life, workplaces and communities across Canada.
Most fathers are in the paid labour force, and research shows that an increasing share is involved in their children’s early years. As more dads are managing multiple responsibilities at home and at work than in previous generations, workplaces and parental leave policies have evolved to support this growing role in family life.
- According to the 2016 Census, 91% of fathers in couples and 82% of lone fathers in Canada were employed.1
- In 2017, 81% of new and expectant fathers2 inside Quebec received (or were intending to claim) parental benefits, compared with only 12% in the rest of Canada.3, 4
- In 2018, the majority of surveyed fathers reported that they are afraid that taking leave will negatively impact their finances (75%) and/or their relationship with their managers at work (51%).5
- As discussed in the Vanier Institute’s May 14, 2019 webinar on Understanding the Parental Sharing Benefit and the Caregiving Benefits, new and expectant fathers6 in eligible two-parent families have had access to a new use-it-or-lose-it 5- to 8-week employment insurance (EI) parental sharing benefit since March 2019, which they can take at any point following the arrival of their child.7
- A 2015 study found that fathers in Quebec who took leave spent an average half hour more per day at the family home than those outside of Quebec.8
- In 2015, 72% of surveyed fathers of children aged 0 to 4 reported that they spent time providing help or care to children that day. Of the total number of reported hours parents spent on these tasks, 35% of this work was done by fathers (28% in 1986).9
Notes
- Statistics Canada, “Father’s Day… By the Numbers,” The Daily (page last updated June 28, 2017). Link: https://bit.ly/2xkDOui.
- This percentage also includes women second partners in same-sex couples, although they account for a small share of the total.
- The share of spouses or partners claiming benefits is typically higher in Quebec, as the Quebec Parental Insurance Plan includes benefits that apply exclusively to the second parent.
- Statistics Canada, “Employment Insurance Coverage Survey, 2017,” The Daily (November 15, 2018). Link: https://bit.ly/2VaYssA.
- Legerweb, “Dove Men+Care Data Reveals Persistent Paternity Leave Stigmas,” media release (April 23, 2019). Link: https://bit.ly/2vfYno3.
- The benefit is available to all second partners (i.e. women second parents in same-sex couples, in addition to fathers), and includes adoptive parents.
- The transcript, PowerPoint presentation and webinar video stream are available on the Vanier Institute website. Link: http://bit.ly/2WmDl1S.
- Ankita Patnaik, “‘Daddy’s Home!’ Increasing Men’s Use of Paternity Leave,” briefing paper prepared for the Council on Contemporary Families (April 2, 2015). Link: http://bit.ly/1Igwa0Y.
- Patricia Houle, Martin Turcotte and Michael Wendt, “Changes in Parents’ Participation in Domestic Tasks and Care for Children from 1986 to 2015,” Spotlight on Canadians: Results from the General Social Survey, Statistics Canada catalogue no. 89-652-X (page last updated June 7, 2017). Link: http://bit.ly/2rJ4AZL.
A Snapshot of Grandparents in Canada (May 2019 Update)

Canada’s grandparents are a diverse group. Many of them contribute greatly to family functioning and well-being in their roles as mentors, nurturers, caregivers, child care providers, historians, spiritual guides and “holders of the family narrative.”
As Canada’s population ages and life expectancy continues to rise, their presence in the lives of many families may also increase accordingly in the years to come. With the number of older Canadians in the workforce steadily increasing, they are playing a greater role in the paid labour market – a shift felt by families who rely on grandparents to help provide care to their grandchildren or other family members. All the while, the living arrangements of grandparents continue to evolve, with a growing number living with younger generations and contributing to family households.
Using newly released data from the 2017 General Social Survey, we’ve updated our popular resource A Snapshot of Grandparents in Canada, which provides a statistical portrait of grandparents, their family relationships and some of the social and economic trends at the heart of this evolution.
Highlights:
- In 2017, 47% of Canadians aged 45 and older were grandparents, down from 57% in 1995.1
- In 2017, the average age of grandparents was 68 (up from 65 in 1995), while the average age of first-time grandparents was 51 for women and 54 for men in 2017.2, 3
- In 2017, nearly 8% of grandparents were aged 85 and older, up from 3% in 1995.4
- In 2017, 5% of grandparents in Canada lived in the same household as their grandchildren, up slightly from 4% in 1995.5
- In 2017, grandparents who were born outside Canada were more than twice as likely as Canadian-born grandparents to live with grandchildren (9% and 4%, respectively), the result of a complex interplay of choice, culture and circumstance.6
Download A Snapshot of Grandparents in Canada (May 2019) from the Vanier Institute of the Family.
Battams, N. (2019). A snapshot of grandparents in Canada. The Vanier Institute of the Family. https://doi.org/10.61959/disx1332e
Published on May 28, 2019
1 Statistics Canada, “Family Matters: Grandparents in Canada,” The Daily (February 7, 2019). Link: https://bit.ly/2BnyyFO.
2 Ibid.
3 No comparator provided because this is the first time the question has been asked in the General Social Survey.
4 Ibid.
5 Statistics Canada, “Family Matters: Grandparents in Canada.”
6 Ibid.
Mother’s Day 2019: New Moms Older, More Likely to Be Employed Than in the Past

May 12, 2019 is Mother’s Day, a time to recognize and celebrate the millions of women in Canada who are raising (and co-raising) future generations, often while managing multiple roles at home, in their workplaces and in their communities. The complex relationship between women, work and family across the country has evolved significantly across generations, as new moms are older and more likely to be employed than in the past – trends that are reflected in data recently released from Statistics Canada.
According to recent Vital Statistics data, women across the country are increasingly waiting longer to have children – in fact, the fertility rates of women in their early 20s and late 30s flipped over the past 20 years. Many are instead focusing first on pursuing post-secondary education and career development – continuing a long-term trend observed over the past several decades.
- In 2017, the fertility rate in Canada for women aged 20 to 24 stood at 36 live births per 1,000 women, down from 58 per 1,000 in 2000.1
- In 2017, the fertility rate in Canada for women aged 35 to 39 was 56 live births per 1,000 women, nearly double the rate in 2000 (34 per 1,000).2
- In 2016, the average age of first-time mothers was 29.2 years, up from 27.1 years in 2000.3
Most of these new moms are (and remain) in the paid labour force at the time of birth or adoption of their newborn, often utilizing community supports to facilitate work and family responsibilities.
- In 2016, the employment rate of mothers whose youngest child was aged 0 to 2 was 71%, up from 66% in 2001. As in previous years, this rate was higher in Quebec in 2016 (80%).4
- In 2017, 79% of recent mothers across Canada had insurable employment, 90% of whom received maternity and/or parental benefits.5
- As in previous years, recent moms in Quebec were more likely to have insurable employment (97%) and to have received benefits than their counterparts in the rest of Canada (91%).
- In 2016–17, women accounted for 85% of all parental benefits claims made, down from 89% in 2002.6, 7
Since December 2017, new and expectant parents have been provided with more flexibility regarding the timing and duration of the benefit period.
- New and expectant parents are now able to choose an extended parental benefits option, which allows them to receive their EI parental benefits over a period of up to 18 months at a benefit rate of 33% of average weekly earnings. Compared with the standard parental benefits option, this extends the duration of the benefit period but decreases the benefit rate, which stand at 12 months and 55% of average weekly earnings, respectively.8
- Expectant mothers are also now able to access benefits up to 12 weeks before their due date – four weeks earlier than the previous eight-week limit (no additional weeks are available).9
- In 2017, among recent mothers who had worked as an employee within the previous two years, more than 1 in 5 took or planned to take more than 12 months away from work (21%).10
Published on May 8, 2019
Notes
1 Statistics Canada, Crude Birth Rate, Age-specific Fertility Rates and Total Fertility Rate (Live Births) (Table 13-10-0418-01), page last updated May 2, 2019. Link: https://bit.ly/2PKZV2S.
2 Ibid.
3 Claudine Provencher et al., “Fertility: Overview, 2012 to 2016,” Report on the Demographic Situation in Canada, Statistics Canada catalogue no. 91-209-X (June 5, 2018). Link: https://bit.ly/2JUU872.
4 Martha Friendly et al., “Early Childhood Education and Care in Canada 2016,” Child Care Research and Research Unit (CRRU) (April 2018). Link: https://bit.ly/2TC1BwL.
5 Statistics Canada, “Employment Insurance Coverage Survey, 2017,” The Daily (November 15, 2018). Link: https://bit.ly/2VaYssA.
6 Employment and Social Development Canada, “New Five-Week Employment Insurance Parental Sharing Benefit One Month Away,” News Release (February 18, 2019). Link: https://bit.ly/2TUnXJN.
7 Canada Employment Insurance Commission, Employment Insurance 2002 Monitoring and Assessment Report (March 31, 2003). Link: https://bit.ly/2VRq99k.
8 Learn more in “Webinar Content: Changes to EI Special Benefits,” Transition (January 24, 2018). Link: https://bit.ly/302utBQ.
9 Ibid.
10 Statistics Canada, “Employment Insurance Coverage Survey, 2017.”
2018 UPDATE: A Snapshot of Military and Veteran Families in Canada
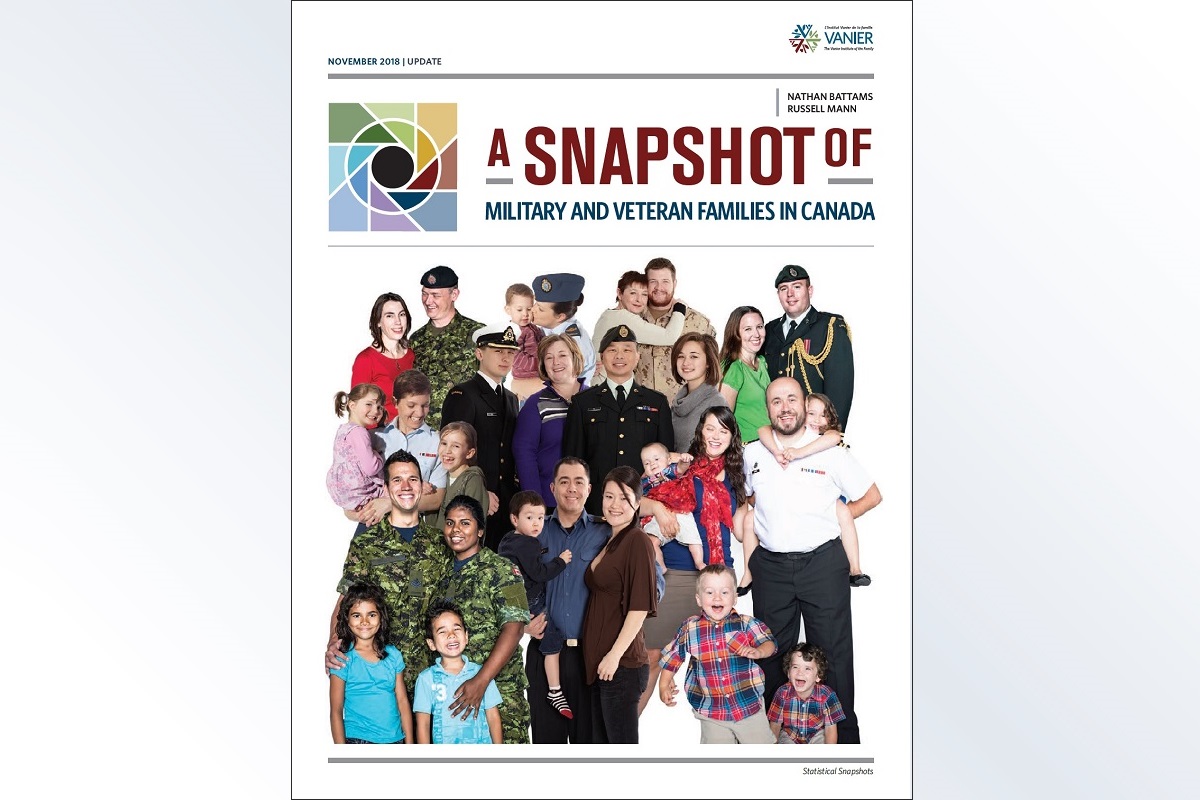
Download A Snapshot of Military and Veteran Families in Canada
Canada’s military and Veteran families are diverse, resilient and strong, and they are a source of pride for the country. They engage with – and play important roles in – their workplaces, communities and society as a whole.
The “military journey” is often characterized by mobility, absence and the risk of illness, injury or death. Professionals and practitioners can benefit from “military literacy” – an understanding of the unique experiences and lifestyle characteristics of Canadian Armed Forces (CAF) personnel, Veterans and their families. To enhance understanding of these families and their experiences, the Vanier Institute of the Family is highlighting new research and data1 on military and Veteran families in Canada with a 2018 update of A Snapshot of Military and Veteran Families in Canada.
Military families experience high mobility and frequent periods of separation
- Every year in Canada, an estimated 10,000 military families are relocated due to postings (8,000 of whom move to new provinces), which accounts for one-quarter of all Regular Forces personnel in Canada.
- In 2018, among surveyed CAF Regular Force members, nearly three in 10 (29%) reported that they had relocated at least four times due to military postings throughout their career.
- In 2017, two-thirds of Regular Forces personnel reported experiencing extended absences from their family.
Military children are affected by relocations, but they are resilient and most adjust quickly
- Research shows that while most military children do find relocation stressful, they are resilient, and this stress typically diminishes within a half-year after moving.
- In 2016, among surveyed CAF parents, only one in 10 (10%) reported that their child(ren) “had trouble adjusting after moving/relocation,” while nearly half (47%) did not experience any issues.
The majority of Veterans and their families do not experience difficulties in transition to civilian life
- In 2016, Veterans were more likely to report that the transition to civilian life was easy compared with those who said it was difficult for themselves and their families.
- 52% said the transition was “easy” for themselves, 32% said it was “difficult.”
- 57% said the transition was “easy” for their partners, 28% said it was “difficult.”
- 60% said the transition was “easy” for their children, 17% said it was “difficult.”
- Nearly nine in 10 Veterans reported being satisfied/very satisfied with life (86%) and their family (88%).
Note
- Source information can be found in the document.
Battams, N. (2018). 2018 Update: A snapshot of military and veteran families in Canada. The Vanier Institute of the Family. https://doi.org/10.61959/cyth4819e
Modern Family Finances: Students in Canada (infographic)
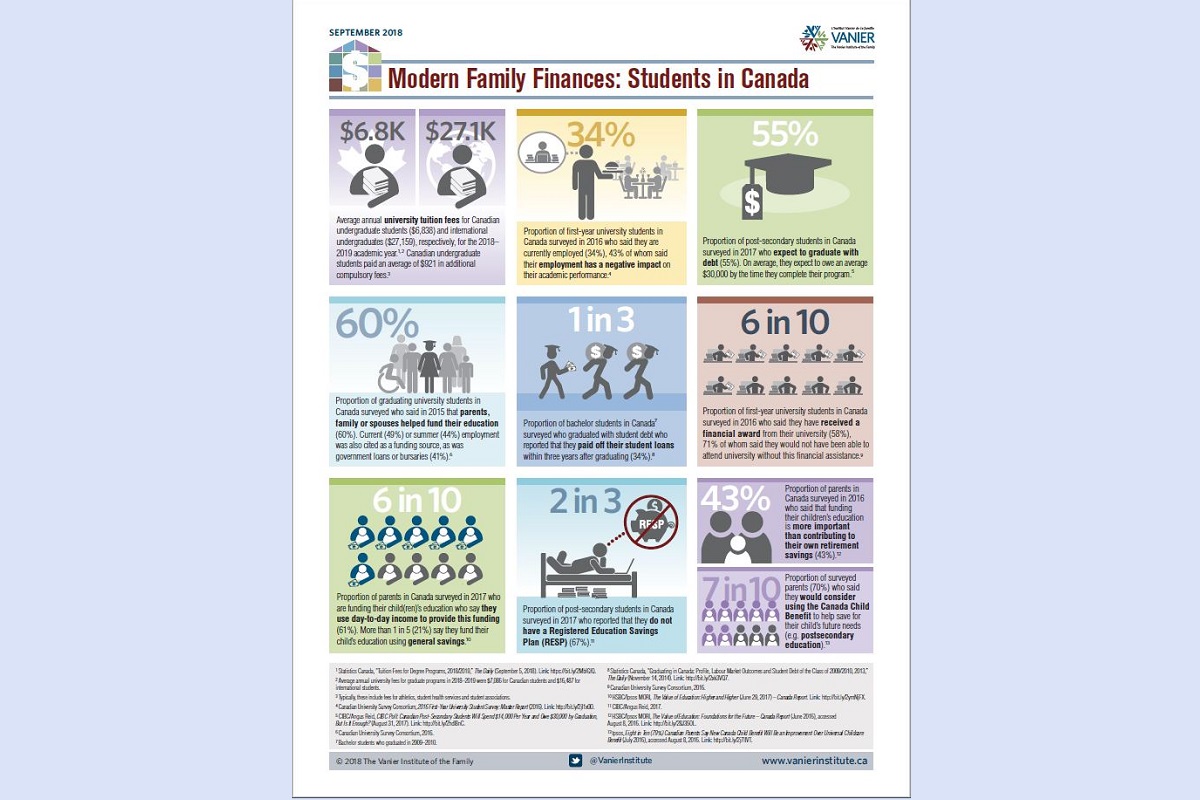
Download the Modern Family Finances: Students in Canada infographic.
Post-secondary education is a family investment; regardless of who covers the costs, decisions surrounding higher education can have a significant impact on the lives of young adults and their families. A degree or diploma can open doors to employment and the possibility of higher earnings; however, higher education involves costs that must be managed, and families often play an important role in helping students manage their finances.
Using new survey information and data from Statistics Canada, the Vanier Institute has updated our infographic on students and family finances in Canada.
Highlights include:
- University tuition fees for Canadian undergraduate students were approximately $6,800 for the 2018–2019 academic year, with an additional $920 in additional compulsory fees.
- Six in 10 surveyed students reported that parents, family or spouses helped fund their education.
- Among surveyed parents who are funding their child(ren)’s education, 6 in 10 say that they use day-to-day income to provide this funding.
- Six in 10 surveyed first-year university students in Canada said they have received a financial award from their university, 71% of whom said they would not have been able to attend university without this financial assistance.
- One in three surveyed bachelor graduates who graduated with student debt reported that they paid off their student loans within three years after graduating.
Download the Modern Family Finances: Students in Canada infographic.
Facts and Stats: Divorce, Separation and Uncoupling in Canada

Just as families continuously evolve, so do the interpersonal relationships at the heart of family life. Every year, thousands of Canadians come together to form committed family relationships – some of whom decide to raise children together – and sometimes, a variety of reasons may compel them to end their relationship, which can result in diverse, unique and often difficult transitional experiences for the family.
Patterns of coupling or partnering and uncoupling or unpartnering have evolved throughout Canada’s history in response to social, economic, cultural and legal changes. While divorce rates were low for most of the 20th century due to restrictive social norms and legal processes, there has since been an increase in the share of families who have experienced separation, divorce and uncoupling – particularly following the liberalization of divorce through the 1968 Divorce Act and further amendments in 1986.
Whether it’s separation and divorce following a marriage, or the uncoupling of a common-law union, this change can be emotionally, socially, legally and/or financially challenging for family members. Current research shows, however, that the impact on adults and children – including the speed and degree of adjustment – varies widely and is shaped by post-divorce circumstances, access to community programs and services, as well as the availability of information, resources and support during the transition.
In May 2018, the federal government proposed amendments to the Divorce Act to mitigate the adversarial nature of family court proceedings following separation and divorce. These changes are meant to serve the “best interests of the children,” and include defining what these “best interests” are, updating adversarial language such as “custody” and “access” to terms that include “parenting orders” and “parenting time,” establishing clear guidelines for when one parent wants to relocate with a child, making it easier for people to collect support payments, strengthening the capacity of courts to address family violence and compelling lawyers to encourage clients to use family-dispute resolution services, such as mediation.
In this evolving social, cultural and legal context, our new fact sheet uses data from the General Social Survey1 to explore family experiences of divorce, separation and uncoupling in Canada.
Highlights include:
- In 2017, an estimated 9% of Canadians aged 15 and older were divorced or separated (and not living common law), up from 8% in 1997.
- In 2016, surveyed Canadian lawyers reported charging an average $1,770 in total fees for uncontested divorce cases and $15,300 for contested divorce cases.
- In 2011, nearly 1 in 5 Canadians (19%) said that their parents are divorced or separated, nearly twice the share in 2001 (10%).
- In 2011, two-thirds (66%) of divorced Canadians said they do not have remarriage intentions (23% said they were uncertain).
Download Facts and Stats: Divorce, Separation and Uncoupling in Canada (PDF)
Among top reasons for divorces in Canada we can find:
- Infidelity: Extramarital affairs break trust and create an irreparable rift between partners.
- Communication Breakdown: Lack of effective communication leads to misunderstandings and resentment, causing many marriages to fail.
- Addictions and Gambling problem: Addiction to legal online casinos can lead to financial ruin and neglect of family responsibilities, causing significant marital issues and divorce.
- Financial Problems: Disagreements over spending, debt, and financial priorities often strain marriages.
Notes
- The most recent data available on this topic is from 2011. This fact sheet will be updated when new data is released in Fall 2018.
Infographic: Fathers and Work in Canada
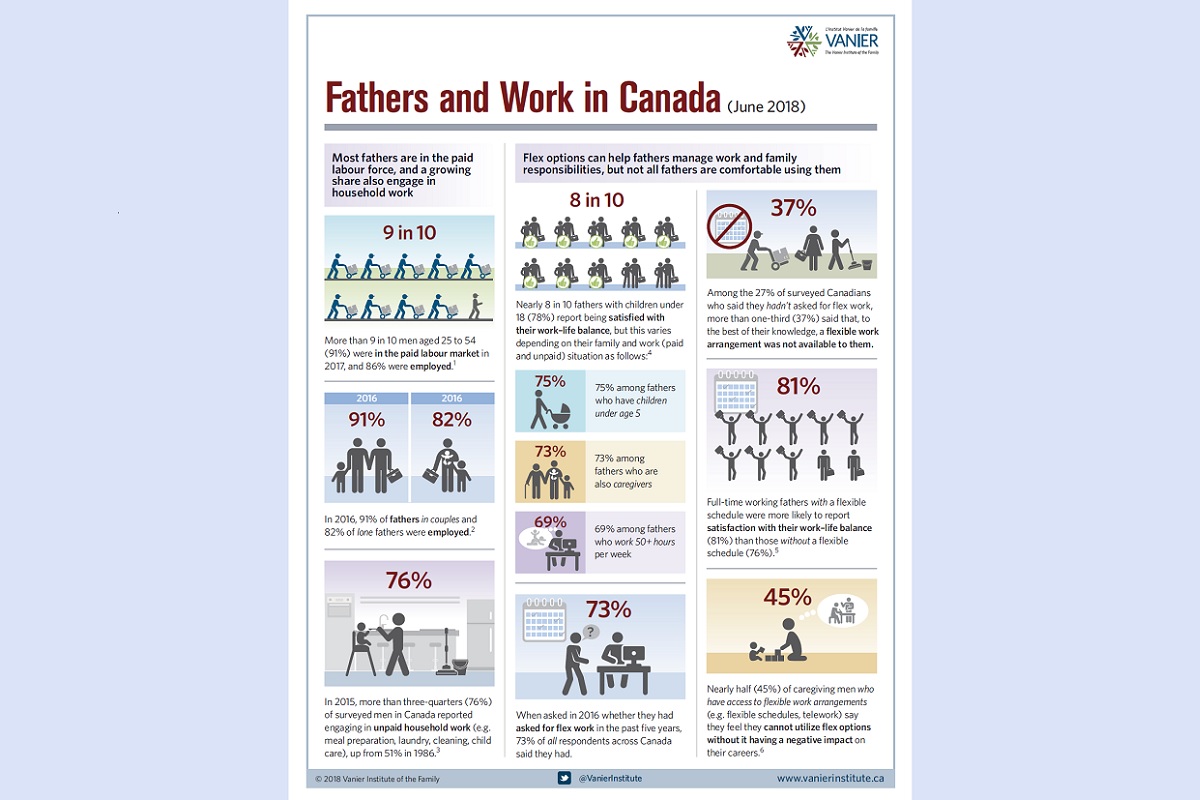
Most fathers in Canada are in the paid labour force, and research shows that a growing share are involved in their child’s early years, and are more likely to assume household management responsibilities than in the past. As fathers manage multiple responsibilities at home, at work and in their communities, parental leave and flexible work arrangements can play an important role in facilitating their growing role in family life.
Using current Census and Labour Force Survey data, our new infographic provides a statistical glance at evolving work–family experiences for fathers in Canada.
Highlights include:
- In 2016, 91% of fathers in couples and 82% of lone fathers were employed.1
- In 2016, new and expectant fathers inside Quebec were roughly 6 times as likely to report having received (or were intending to claim) parental benefits than fathers in the rest of Canada (80% and 13%, respectively).2
- As of June 2019, new and expectant fathers in eligible two-parent families3 will have access to a new “use-it-or-lose-it” employment insurance (EI) parental sharing benefit, which they can take at any point following the arrival of their child.4
- In 2016, when asked whether they had asked for flex work in the past five years, 73% of surveyed Canadians said they had.5
- In 2012, full-time working fathers with a flexible schedule were more likely to report satisfaction with their work–life balance (81%) than those without a flexible schedule (76%).6
Download the Fathers and Work in Canada infographic from the Vanier Institute of the Family.
Notes
- Statistics Canada, “Father’s Day… By the Numbers,” The Daily (page last updated June 28, 2017). Link: https://bit.ly/2xkDOui.
- Employment and Social Development Canada, Employment Insurance Monitoring and Assessment Report for the Fiscal Year Beginning April 1, 2016 and Ending March 31, 2017 (page last updated June 5, 2018). Link: https://bit.ly/2LA9WgG.
- Including adoptive and same-sex couples.
- To learn more about pending changes to parental leave, see Canada’s New Parental Sharing Benefit, a backgrounder from the Department of Finance Canada (n.d.). Link: https://bit.ly/2CMmKuX.
- Employment and Social Development Canada, “When Work and Caregiving Collide: How Employers Can Support Their Employees Who Are Caregivers,” Report from the Employer Panel for Caregivers (February 16, 2015). Link: https://bit.ly/2sf0QOv.
- Statistics Canada, “Satisfaction with Work–Life Balance: Fact Sheet,” Spotlight on Canadians: Results from the General Social Survey, Statistics Canada catalogue no. 89-652-X (April 14, 2016). Link: http://bit.ly/1S7H2nb.
Families in Canada Interactive Timeline
Today’s society and today’s families would have been difficult to imagine, let alone understand, a half-century ago. Data shows that families and family life in Canada have become increasingly diverse and complex across generations – a reality highlighted when one looks at broader trends over time.
But even as families evolve, their impact over the years has remained constant. This is due to the many functions and roles they perform for individuals and communities alike – families are, have been and will continue to be the cornerstone of our society, the engine of our economy and at the centre of our hearts.
Learn about the evolution of families in Canada over the past half-century with our Families in Canada Interactive Timeline – a online resource from the Vanier Institute that highlights trends on diverse topics such as motherhood and fatherhood, family relationships, living arrangements, children and seniors, work–life, health and well-being, family care and much more.
View the Families in Canada Interactive Timeline.*
Full topic list:
- Motherhood
o Maternal age
o Fertility
o Labour force participation
o Education
o Stay-at-home moms
- Fatherhood
o Family relationships
o Employment
o Care and unpaid work
o Work–life
- Demographics
o Life expectancy
o Seniors and elders
o Children and youth
o Immigrant families
- Families and Households
o Family structure
o Family finances
o Household size
o Housing
- Health and Well-Being
o Babies and birth
o Health
o Life expectancy
o Death and dying
View all source information for all statistics in Families in Canada Interactive Timeline.
* Note: The timeline is accessible only via desktop computer and does not work on smartphones.
Published February 8, 2018
A Snapshot of Family Diversity in Canada (February 2018)
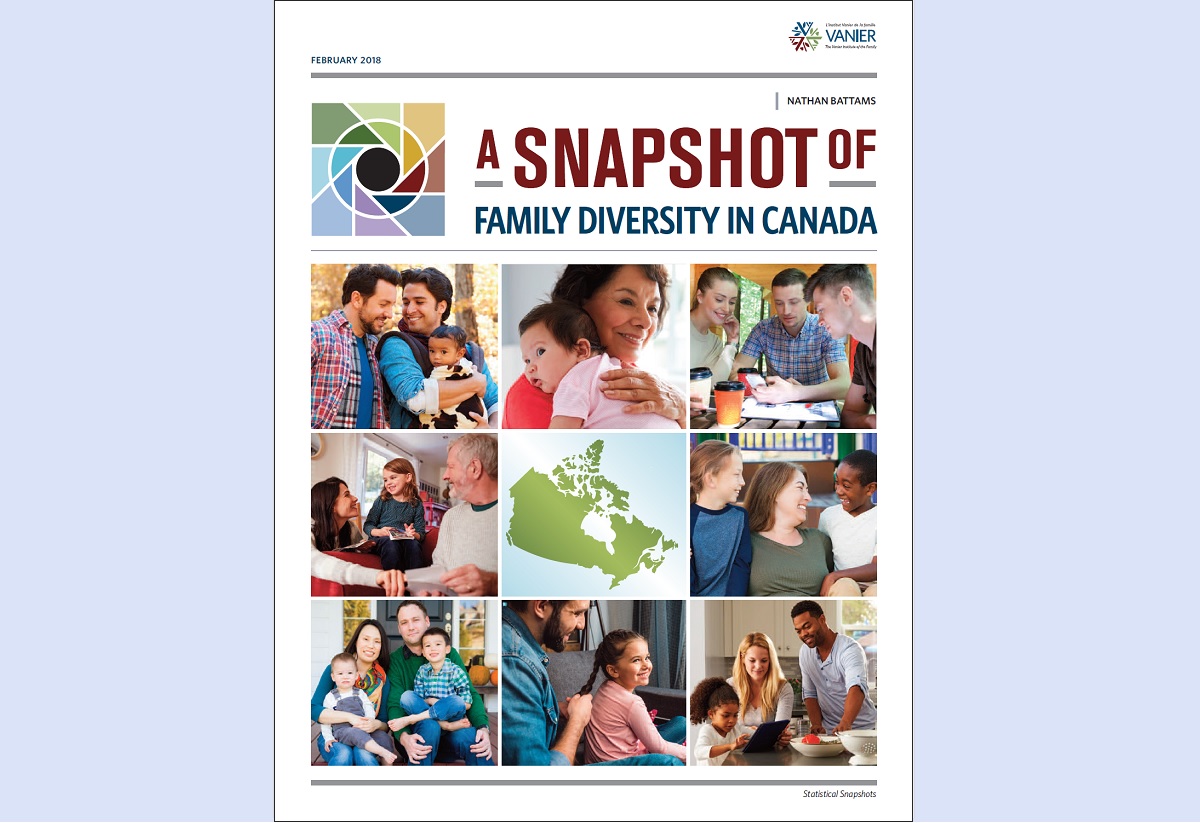
Download A Snapshot of Family Diversity in Canada (February 2018).
For more than 50 years, the Vanier Institute of the Family has monitored, studied and discussed trends in families and family life in Canada. From the beginning, the evidence has consistently made one thing clear: there is no single story to tell, because families are as diverse as the people who comprise them.
This has always been the case, whether one examines family structures, family identities, family living arrangements, family lifestyles, family experiences or whether one looks at the individual traits of family members, such as their ethnocultural background, immigration status, sexual orientation or their diverse abilities.
Building on our recent infographic, Family Diversity in Canada (2016 Census Update), our new Statistical Snapshot publication provides an expanded and more detailed portrait of modern families in Canada, as well as some of the trends that have shaped our vibrant and evolving family landscape over the years. Based on current data and trend analysis, this overview shows that diversity is, was and will continue to be a key characteristic of family life for generations to come – a reality that contributes to Canada’s dynamic and evolving society.
Highlights include:
- According to Statistics Canada, there were 9.8 million Census families living across Canada in 2016.
- 66% of families in Canada include a married couple, 18% are living common-law and 16% are lone-parent families – diverse family structures that continuously evolve.
- Among Canada’s provinces, people in Quebec stand out with regard to couple/relationship formation, with a greater share living common-law than the rest of Canada (40% vs. 16%, respectively) and fewer married couples (60% vs. 84%, respectively) in 2016.
- In 2016, 1.7 million people in Canada reported having an Aboriginal identity: 58% First Nations, 35% Métis, 3.9% Inuk (Inuit), 1.4% other Aboriginal identity and 1.3% with more than one Aboriginal identity.
- In 2016, 22% of people in Canada reported that they were born outside the country – up from 16% in 1961.
- In 2016, more than 1 in 5 people in Canada (22%) reported belonging to a visible minority group, 3 in 10 of whom were born in Canada.
- 73,000 same-sex couples were counted in the 2016 Census, 12% of whom are raising children.
- In 2016, there were nearly 404,000 multi-generational households in Canada – the fastest-growing household type since 2001 (+38%).
- In 2011, 22% of Inuk (Inuit) grandparents, 14% of First Nations grandparents and 5% of Métis grandparents lived with their grandchildren, compared with 3.9% of among non-Indigenous grandparents.
- In 2014, 1 in 5 Canadians aged 25 to 64 reported living with at least one disability. Disability rates were higher for women (23%) than men (18%).
- More than one-quarter (27%) of Canadians surveyed in 2014 said religion is “very important” in their lives.
- One-quarter of Canadians reported “no religious affiliation” in the 2011 Census (most recent data available), up from 17% in 2001.
Download A Snapshot of Family Diversity in Canada (February 2018).
Modern Family Finances: Income in Canada (January 2018)

Much like families themselves, family finances in Canada is a topic characterized by diversity, complexity and perpetual evolution. Family income is no exception. 2016 Census data shows that households across Canada receive income from a variety of sources, and these economic arrangements change over time as families adapt and react to social, economic, cultural and environmental forces.
The complex and multi-faceted nature of family finances can make it a difficult topic to fully comprehend. No measure of family finances exists in isolation, and all are interconnected: if a family’s income is too low, then it may be impossible for them to build savings; if expenses are too high, debt may be just around the corner; if debt is too high, it can reduce family wealth – and so on. However, much can be learned about the whole of finances by examining the topic through a family lens.
Every family household has its own unique constellation of income sources that they manage to fulfill their obligations at home and in their communities. These arrangements typically aren’t static – they evolve throughout the life cycle as family circumstances change, along with the resources available to them.
To explore this topic in further detail, the Vanier Institute has published Modern Family Finances: Income in Canada (January 2018).
Highlights include:
- In 2015, the total median household income in Canada was approximately $70,300 before taxes ($61,300 after taxes), and $34,200 before taxes (just under $30,900 after taxes) for individuals.
- Household income included revenue from a variety of sources, including employment income (approximately 71% of Canadians received employment income), investments (30%), CPP/QPP benefits (23%), OAS/GIS benefits (18%), the Canada Child Tax Benefit (11%), Employment Insurance benefits (9%), social assistance (5%) and more.
- Incomes are lower than the national average and low-income rates are higher for women; First Nations, Inuk (Inuit) and Métis people; immigrants (particularly for recent immigrants and non-permanent residents); visible minorities; and persons living with disabilities.
- In 2015, nearly one-third (32%) of married or common-law couples in Canada received “fairly equal” incomes, although, on average, women earned an estimated $0.87 for every dollar earned by men.
- Debt is consuming a smaller share of household income than in previous decades, with the share of income devoted to servicing the interest on household debt falling from 10.8% in 1991 to 6.4% in 2015.
- One in five (19.8%) seniors in Canada (1.1M) reported that they worked at some point in 2015 – nearly twice the rate recorded in 1995 (10.1%).
- Many Canadians of all ages plan to keep working to ensure sufficient income as seniors, with more than one-third (36%) reporting in 2014 that ongoing employment earnings are a part of their financial retirement plan.
Income in Canada is a part of the Vanier Institute’s Modern Family Finances series, which addresses particular topics such as income and expenditures; savings and debt; and wealth and net worth. Subsequent editions in this series will focus on unique experiences such as family finances among military and Veteran families, families on the move, and families living with disability.
This bilingual resource will be updated periodically as new data emerges. Sign up for our monthly e-newsletter to find out about updates, as well as other news about publications, projects and initiatives from the Vanier Institute.
Download Modern Family Finances: Income in Canada from the Vanier Institute of the Family.
Infographic: Canada’s Families on the Farm

Family farms have played a significant role in Canada’s history, both in terms of the contributions that agriculture has provided in the development of local and provincial economies, and with regard to the role farming has played in shaping community and familial identities. Farming has a strong impact on the lives of families involved in the practice, as it is a unique experience that ties together notions of home, work, culture and kinship.
The evolution of farm families in Canada reflects some of the broader trends that are shaping the “family landscape” across the country, such as population aging, smaller families, a growing share of women in the labour force, the increased use of technology at work and a diversification of family income sources.
To explore Canada’s farm families, the Vanier Institute of the Family has published an infographic that features data from the 2016 Census of Agriculture.
Highlights include:
- Canada was home to more than 193,000 farms in 2016, down 5.9% from 2011.
- Canada was home to nearly 102,000 farm families in 2013, and the number of farm families decreased every year over the prior decade.
- The average age of farm operators increased from 47.5 years in 1991 to 55 years in 2016.
- The number of farm families with two family members rose from 43% in 2003 to 51% in 2013, while the share with five or more fell from 19% to 14%.
- 8.4% of all farms across Canada in 2016 reported having a written succession plan, and a family member was identified as the successor for 96% of these farms.
- In 2015, 57% of operators aged 60 and over were on farms that reported the use of technology, compared with 81% for those under the age of 40.
Download the Canada’s Families on the Farm infographic from the Vanier Institute of the Family.
Learn more in “Families on the Farm: A Portrait of Generations and Migrant Workers in Canada,” a chapter prepared by the Vanier Institute for Deep Roots, published by the United Nations as part the International Year of Family Farming.
Published on January 16, 2018
Modern Family Finances: Seniors in Canada
Canada’s population is rapidly aging, which means a growing number of seniors across the country are managing household finances in an evolving economic climate. In this context, many are choosing to remain in – or return to – the paid labour market to manage their financial responsibilities, while others focus on other diverse income sources to meet their needs.
As seniors and their families adapt their financial management strategies and their aspirations in response to this ever-changing environment, they in turn are reshaping workplaces, retirement and the economy at large. To explore the relationship between seniors and family finances, we’ve published Modern Family Finances: Seniors in Canada, which brings together statistics from a variety of sources about seniors and their economic well-being, including data about employment, income, retirement and debt among this age group.
Highlights include:
- In 2016, the average retirement age in Canada was 63.6 years – a slow but steady increase from a low of 60.9 years in 1998.
- More than one-third (36%) of Canadians in the labour force say that ongoing employment earnings are a part of their financial retirement plan.
- In 2015, 3 in 10 seniors in Canada reported having employment income, with significantly higher rates among Inuit seniors (46%).
- In 2015, nearly 1 in 7 seniors lived with low income – nearly four times the rate in 1995. Rates were higher among senior women (17%, vs. 12% among senior men), recent immigrant seniors (22.2%) and seniors reporting an Aboriginal identity (21.5%).
- In 2015, nearly 1 in 5 seniors in Canada had “unaffordable” shelter costs, spending more than 30% of average total monthly income on housing.
- Nearly 4 in 10 of surveyed seniors in Canada (37%) say they plan on leaving an inheritance to a grandchild.
This bilingual resource will be updated periodically as new data emerges. Sign up for our monthly e-newsletter to find out about updates, as well as other news about publications, projects and initiatives from the Vanier Institute.
Download Modern Family Finances: Seniors in Canada from the Vanier Institute of the Family.
Published on November 30, 2017
Facts and Stats: Families and Mental Health in Canada

At some point, most families find themselves affected by mental illness, whether it’s because a family member (or multiple family members) personally experiences a mental health condition or because they’re providing care to someone else – or both. With appropriate treatment and support, however, most people who experience a mental illness will recover,1 and families often play an important role in providing, arranging or helping pay for care.
Our new fact sheet provides an overview of families and mental health in Canada, including rates of mental health conditions within families, factors that contribute to mental illnesses and the roles family members can play in mental health treatment.
Notes
- Centre for Addiction and Mental Health, Mental Illness and Addiction: Facts and Statistics (n.d.), accessed September 20, 2017. Link: http://bit.ly/2jLyV6Y.
Infographic: Family Diversity in Canada (2016 Census Update)
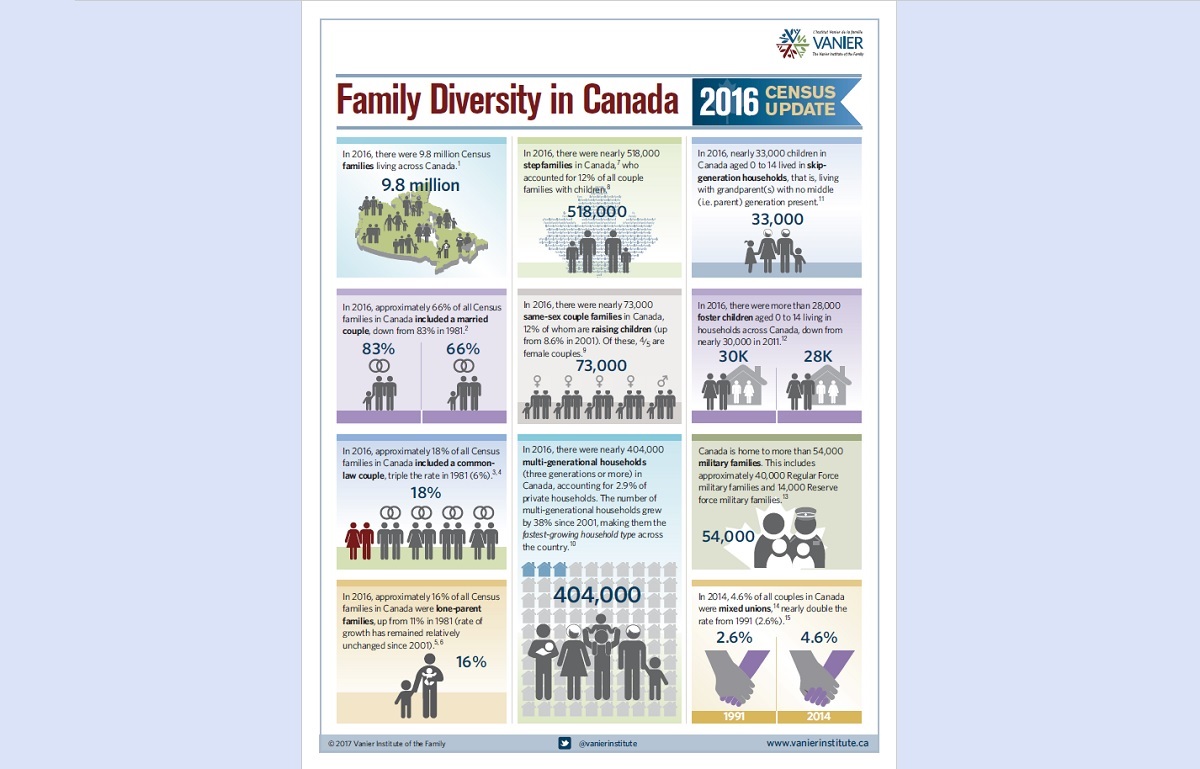
Download the Family Diversity in Canada (2016 Census Update) infographic
The Vanier Institute of the Family has now been exploring families and family life in Canada for more than 50 years. Throughout this half-century of studying, discussing and engaging with families from coast to coast to coast, one thing has been clear from the outset: families in Canada are as diverse as the people who comprise them.
This has always been the case, whether one examines family structures, family identities, family living arrangements, family lifestyles, family experiences or whether one looks at the individual traits of family members such as their ethnocultural background, immigration status, sexual orientation or their diverse abilities.
These parents, children, grandparents, great-grandparents, aunts, uncles, siblings, cousins, friends and neighbours all make unique and valuable contributions to our lives, our workplaces and our communities. As former Governor General of Canada, His Excellency The Right Honourable David Johnston, said at the Families in Canada Conference 2015, “Families, no matter their background or their makeup, bring new and special patterns to our diverse Canadian tapestry.”
Using new data from the 2016 Census, the Vanier Institute has published an infographic on family diversity in Canada.
Highlights include:
- 66% of families in Canada include a married couple, 18% are living common-law, and 16% are lone-parent families – diverse family structures that continuously evolve.
- 518,000 stepfamilies live across the country, accounting for 12% of couples with children under age 25.
- 404,000 households in Canada are multi-generational,1 and nearly 33,000 children live in skip-generation households.2
- 1.7M people in Canada reported having an Aboriginal identity (58.4% First Nations, 35.1% Métis, 3.9% Inuit, 1.4% other Aboriginal identity, 1.3% more than one Aboriginal identity).
- 360,000 couples in Canada are mixed unions,3 accounting for 4.6% of all married and common-law couples.
- 73,000 same-sex couples were counted in the 2016 Census, 12% of whom are raising children.
- 54,000 military families live in Canada, including 40,000 Regular Force military families and 14,000 Reserve force military families.
Download the Family Diversity in Canada (2016 Census Update) infographic.
This bilingual resource is a perpetual publication, and will be updated periodically as new data emerges (older versions are available upon request). Sign up for our monthly e-newsletter to find out about updates, as well as other news about publications, projects and initiatives from the Vanier Institute.
Notes
- Containing three or more generations.
- Living with grandparent(s) with no middle (i.e. parent) generation present.
- Statistics Canada defines a mixed union as “a couple in which one spouse or partner belongs to a visible minority group and the other does not, as well as a couple in which the two spouses or partners belong to different visible minority groups.” Link: http://bit.ly/2tZvrSr.
A Snapshot of Families and Food in Canada

Food is at the heart of family life. A biological necessity for our survival and well-being, food is also much more than that. What we choose to eat is often more than just a matter of personal preferences and whims; in many instances, what we eat reflects our cultural, community and family identities. Sometimes, our choices are made for us based on the availability and accessibility of food.
Regardless of the context, families adapt and react to ensure that dietary needs are being met. Some families have many opportunities to eat together, and these family meals provide a setting where family dynamics and relationships often “play out,” whether it’s in the delegation of cooking roles, discussing an upcoming family vacation or arguing over who has to do the dishes. Sometimes families – particularly those with busy schedules or high mobility – opt to eat meals “on the go.”
A Snapshot of Families and Food in Canada explores the evolving relationships between families and food in Canada, including research and statistics about family meals, eating patterns, nutrition, food security and more.
Highlights include:
- More than 6 in 10 Canadians (62%) surveyed in 2017 said they eat dinner as a family at least five times per week.
- More than one-quarter (26%) of Canadians surveyed in 2017 agree with the statement, “My work–life balance does not permit me to prepare and/or eat my meals at home.”
- The most recent data indicates that 12% of households across Canada (1.3 million) experienced food insecurity in 2014, home to 3.2 million people.
- More than half (52%) of Inuit living in Inuit Nunangat1 aged 25 and over lived in food-insecure households in 2012.
- In 2015, households across Canada spent an average $8,600 on food, an increase of 9.9% since 2010.
- 4 in 10 of those who said it’s become more difficult to afford groceries said they’ve been choosing less healthy options in the aisle to manage the rising prices.
- According to a 2017 study, more than three-quarters of Canadians aren’t meeting Canada Food Guide recommendations for fruit and vegetable consumption, with a resulting estimated economic burden to society of is $4.39 billion per year.
- More than 863,000 people across Canada accessed food banks in March 2016 alone (40% of whom lived in family households with children), 28% higher than in 2008.
- Research shows that the widespread malnutrition experienced by Indigenous children in Canada’s residential school system has had (and continues to have) a multi-generational impact on the health and well-being of their children and grandchildren, contributing to higher rates of chronic conditions.
This bilingual resource will be updated periodically as new data emerges. Sign up for our monthly e-newsletter to find out about updates, as well as other news about publications, projects and initiatives from the Vanier Institute.
Download A Snapshot of Families and Food in Canada from the Vanier Institute of the Family
This Statistical Snapshot publication is dedicated to David Northcott, CM, OM, retired Executive Director of Winnipeg Harvest Food Bank and a founder of both the Canadian Association of Food Banks and the Manitoba Association of Food Banks. David recently completed his second full term on the Vanier Institute Board of Directors, where his enthusiasm, dedication to family well-being and generous heart has had an impact on the entire Vanier Institute team.
Notes
- From Statistics Canada: “Inuit Nunangat is the homeland of Inuit of Canada. It includes the communities located in the four Inuit regions: Nunatsiavut (Northern coastal Labrador), Nunavik (Northern Quebec), the territory of Nunavut and the Inuvialuit region of the Northwest Territories. These regions collectively encompass the area traditionally occupied by Inuit in Canada.” Link: http://bit.ly/2gbzaqo.
Infographic: Modern Couples in Canada

Just as families have evolved across generations, so too have the couple relationships that are a major part of Canada’s “family landscape.” This perpetual change is both a reflection of and a driving force behind some of the evolving social, economic, cultural and environmental forces that shape family life.
Dating, marriage, cohabitation, common-law relationships – the ways people choose to come together, or decide to move apart, are as diverse as the couples themselves. There are, however, some broad trends being witnessed across the country, with family structures diversifying, people forming couple relationships at later ages and family finances taking on a more egalitarian structure.
Using new data from the 2016 Census, the Vanier Institute of the Family has published an infographic on modern couples in Canada.
Highlights include:
- In 2016, married couples accounted for 79% of all couples in Canada, down from 93% in 1981.
- One-quarter of “never-married” Canadians say they don’t intend to get married.
- In 2016, 21% of all couples in Canada were living common-law, up from 6% in 1981.
- The share of twentysomething women (37%) and men (25%) living in couples has nearly halved since 1981 (falling from 59% and 45%, respectively).
- In 2016, 12.4% of all couple families in Canada with children under 25 were stepfamilies, down slightly from 12.6% in 2011.
- There are 73,000 same-sex couples in Canada, 12% of whom are raising children.
- 1 in 5 surveyed Canadians reported in 2011 that their parents are separated or divorced, up from 10% in 2001.
- The share of people living in mixed unions nearly doubled between 1991 and 2011, from 2.6% to 4.6%.1
- 69% of couples with children were dual-earner couples in 2014, up from 36% in 1976.
Download the Modern Couples in Canada infographic from the Vanier Institute of the Family
Notes
- Statistics Canada defines a mixed union as “a couple in which one spouse or partner belongs to a visible minority group and the other does not, as well as a couple in which the two spouses or partners belong to different visible minority groups.”
Facts and Stats: Families and Active Leisure in Canada (2017 Update)

Whether it’s swimming at the beach in the summer, tobogganing in the winter or playing organized sports throughout the year, many families enjoy being physically active in their leisure time, and this exercise can have a positive impact on our individual and family well-being. However, there is growing concern that many people aren’t meeting the recommended guidelines for physical activity, as busy schedules and “screen time” can interfere with our best efforts to keep moving.
Learn about how Canadians of all ages are keeping fit and having fun with our updated fact sheet on families and active leisure in Canada!
Download Facts and Stats: Families and Active Leisure in Canada from the Vanier Institute of the Family.
Published on July 25, 2017
A Snapshot of Men, Work and Family Relationships in Canada
Over the past half-century, fatherhood in Canada has evolved dramatically as men across the country adapt and react to social, economic, cultural and environmental contexts. Throughout this period, men have had diverse employment experiences as they manage their multiple roles inside and outside the family home. These experiences have been impacted by a variety of factors, including (but not limited to) cultural norms and expectations, family status, disability and a variety of demographic characteristics, as well as women’s increased involvement in the paid labour force.
While many fathers in previous generations acted exclusively as “traditional” breadwinning father figures, modern fathers are increasingly likely to embrace caring roles and assume more household management responsibilities. In doing so, dads across Canada are renegotiating and reshaping the relationship between fatherhood and work.
Highlights include:
- Men are less likely than in previous generations to fulfill a breadwinner role exclusively. In 2014, 79% of single-earner couple families with children included a breadwinning father, down from 96% in 1976.
- Men account for a growing share of part-time workers. One-quarter (25%) of Canadians aged 25 to 54 who worked part-time in 2016 were men, up from 15% in 1986.
- The proportion of never-married men is on the rise. In 2011, more than half (54%) of men in Canada aged 30 to 34 report never having been married, up from 15% in 1981.
- Canada is home to many caregiving men. In 2012, nearly half (46%) of all caregivers in Canada were men, 11% of whom provided 20 or more hours per week of care.
- Many men want to be stay-at-home parents. Nearly four in 10 (39%) surveyed men say they would prefer to be a stay-at-home parent.
- Many men engage in household work and related activities. Nearly half (45%) of surveyed fathers in North America say they’re the “primary grocery shopper” in their household.
- Flex at work can facilitate work–life balance. More than eight in 10 (81%) full-time working fathers who have a flexible schedule say they’re satisfied with their work–life balance, compared with 76% for those without flex.
This bilingual resource will be updated periodically as new data emerges. Sign up for our monthly e-newsletter to find out about updates, as well as other news about publications, projects and initiatives from the Vanier Institute.
A Snapshot of Population Aging and Intergenerational Relationships in Canada
Canada’s population is aging rapidly, with a higher share of seniors than ever before. While this can present some societal challenges, it also provides growing opportunities for intergenerational relationships, since younger people have a greater likelihood of having more seniors and elders in their lives. Population aging has an impact not only on family relationships, but also on the social, economic, cultural and environmental contexts in which families live.
Using new statistics from the 2016 Census, A Snapshot of Population Aging and Intergenerational Relationships in Canada explores the evolving demographic landscape across the country through a family lens. As the data shows, Canadians are getting older, and “seniorhood” is a growing life stage – a time when many of our parents, grandparents and great-grandparents are continuing to play important roles in our families, workplaces and communities.
Highlights include:
- There are more seniors than ever before in Canada. More than 5.9 million people in Canada are aged 65 and older – up 20% since 2011 and now outnumbering children (5.8 million).
- Nunavut is the youngest region in Canada. Children account for one-third (33%) of the population in Nunavut.
- We’re more likely to become seniors than in the past. In 2012, nine in 10 Canadians were expected to reach age 65, up from six in 10 in 1925.
- The number of multi-generational households is growing. In 2011, 1.3 million people in Canada lived in multi-generational homes, up 40% since 2001.
- Working seniors are on the rise. The labour market participation rate of seniors more than doubled since 2000, from 6.0% to 14% in 2016.
- Canada’s aging population affects family finances. An estimated $750 billion is expected to be transferred to Canadians aged 50 to 75 over the next decade.
This bilingual resource will be updated periodically as new data emerges. Sign up for our monthly e-newsletter to find out about updates, as well as other news about publications, projects and initiatives from the Vanier Institute.
Download A Snapshot of Population Aging and Intergenerational Relationships in Canada from the Vanier Institute of the Family.
A Snapshot of Women, Work and Family in Canada
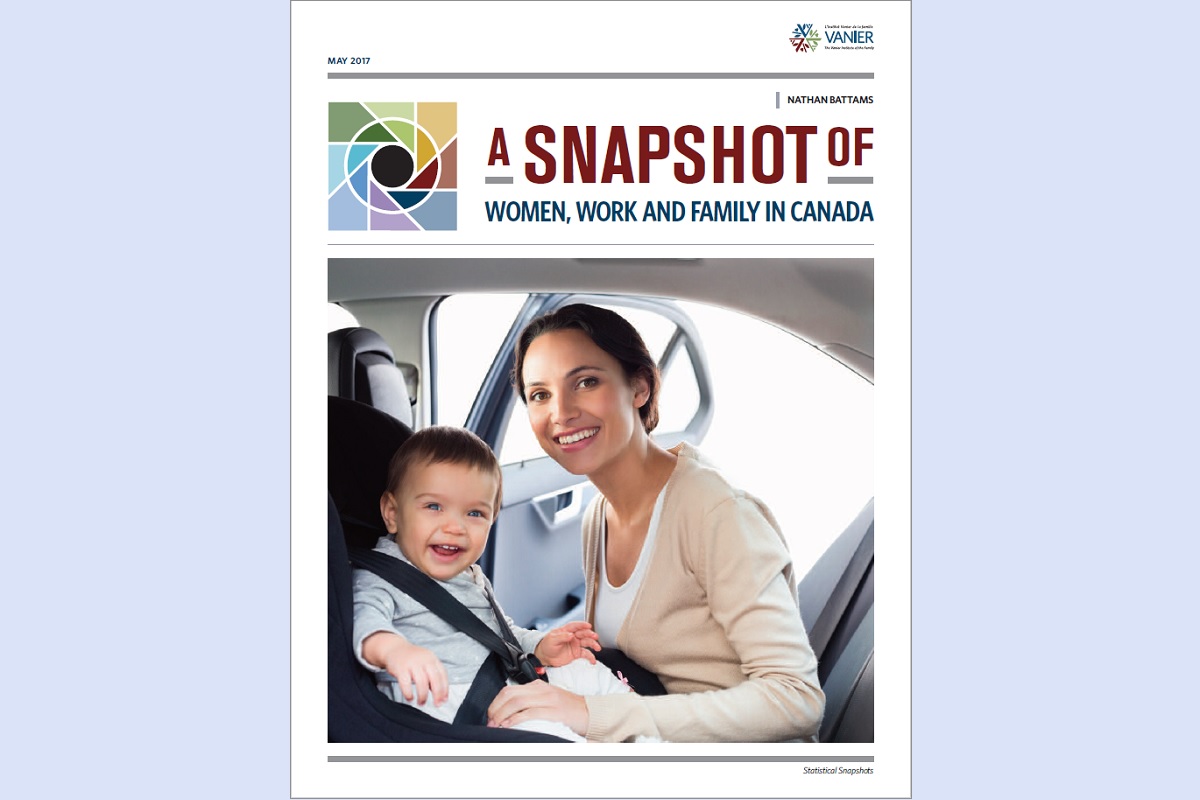
Canada is home to more than 18 million women (9.8 million of whom are mothers), many of whom fulfill multiple responsibilities at home, at work and in the community. Over many generations, women in Canada have had diverse employment experiences that continue to evolve and change. These experiences have differed significantly from those of men, and there is a great deal of diversity in the experiences among women, which are impacted by a variety of factors including (but not limited to) cultural norms and expectations, family status, disability and a variety of demographic characteristics.
To explore the diverse and evolving work and family experiences of women in Canada, the Vanier Institute of the Family has created A Snapshot of Women, Work and Family in Canada. This publication is a companion piece to our Fifty Years of Women, Work and Family in Canada timeline, providing visually engaging data about the diverse work and family experiences of women across Canada.
Highlights include:
- The share of all core working-aged women (25 to 54 years) who are in the labour force has increased significantly across generations, from 35% in 1964 to 82% in 2016.
- Employment rates vary among different groups of core working-aged women, including those who are recently immigrated (53%), women reporting an Aboriginal identity (67%) and those living with a disability (52% to 56%, depending on the age subgroup).
- On average, women without children earn 12% more per hour than those with children – a wage gap sometimes referred to as the “mommy tax.”
- Nearly one-third (32%) of women aged 25 to 44 who were employed part-time in 2016 said that they were working part-time because they were caring for children.
- 70% of mothers with children aged 5 and under were employed in 2015, compared with only 32% in 1976.
- In 2013, 11% of all recent mothers inside Quebec and 36% in the rest of Canada, respectively, did not receive maternity and/or parental leave benefits – a difference attributed to the various EI eligibility regimes in the provinces.
- 72% of all surveyed mothers in Canada report being satisfied with their work–life balance, but this rate falls to 63% for those who are also caregivers.
- 75% of working mothers with a flexible work schedule report being satisfied with their work–life balance – a rate that falls to 69% for those without flexibility.
This bilingual resource will be updated periodically as new data emerges. Sign up for our monthly e-newsletter to find out about updates, as well as other news about publications, projects and initiatives from the Vanier Institute.
Download A Snapshot of Women, Work and Family in Canada from the Vanier Institute of the Family.
Published on May 9, 2017
Infographic: Women, Caregiving and Work in Canada
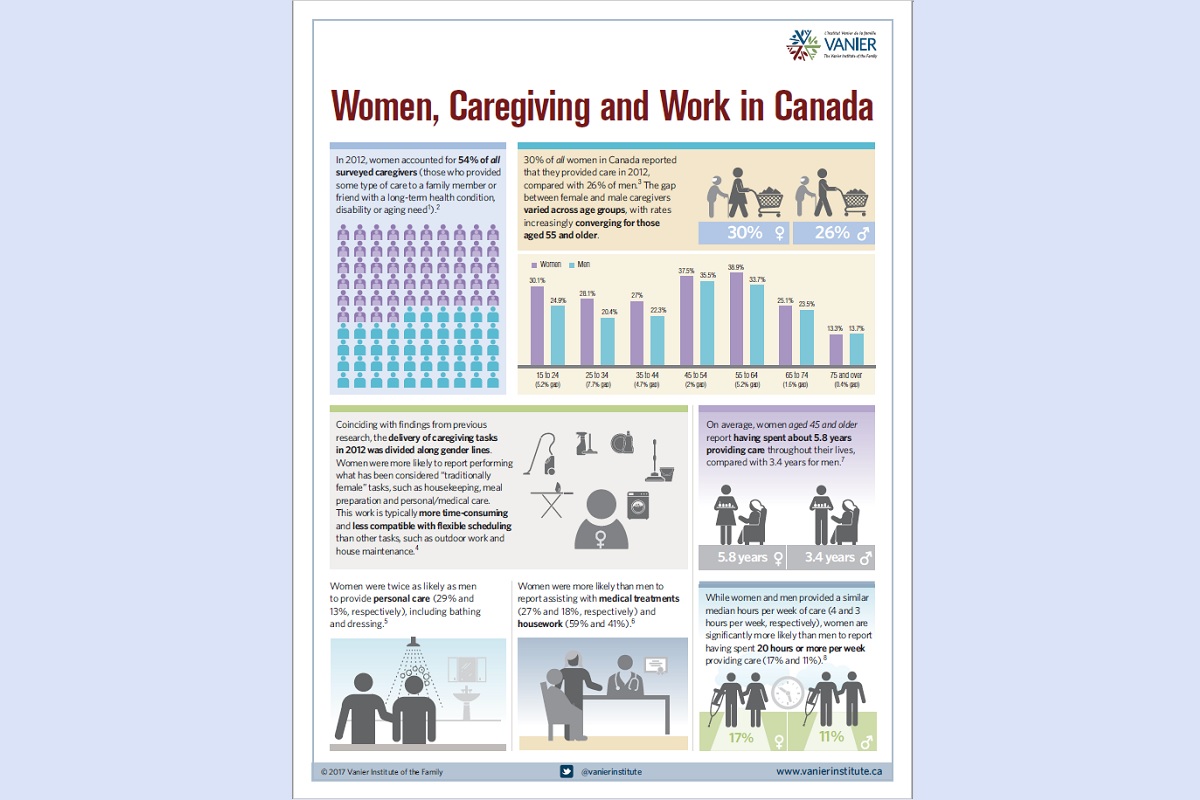
Caregiving is a fact of life and a common family experience in Canada. At some point in their lives, most family members have provided – or will provide – care to a family member or friend with a long-term health condition, disability or aging need. However, Canadians don’t share a single narrative or caregiving experience, as social, economic, cultural and environmental factors shape who is expected to provide care, what kind of care they provide and the consequences of managing caregiving in addition to paid work.
And while the gap between women and men has lessened over the past generation, caregivers have historically been disproportionately women, and this remains true today. Research also shows that on average, women in Canada devote more time to caregiving tasks than men and are more likely to experience negative consequences as a result of their caregiving.
Our new infographic Women, Caregiving and Work in Canada explores family caregiving and work in Canada with a focus on women.
Highlights include:
- 30% of all women in Canada reported that they provided care in 2012.
- Women aged 45 and older reported having spent an estimated 5.8 years providing care throughout their lives, compared with 3.4 years for men.
- Women are significantly more likely than men to report having spent 20 hours or more per week providing care (17% and 11%, respectively).
- An estimated 72% of women caregivers aged 45 to 65 in Canada are also employed.
- Women reported experiencing a variety of employment impacts as a result of their caregiving responsibilities: 30% reported missing at least one full day of work; 6.4% retired early, quit or lost their paid job; and 4.7% turned down a job offer or promotion.
- Estimates show that women caregivers in Canada lost an aggregated $221 million in wages annually between 2003 and 2008 due to absenteeism, reducing work hours or leaving employment entirely.
- Among women caregivers who have access to flexible work arrangements, half (47%) feel they cannot utilize these options without it having a negative impact on their careers.
Download the Women, Caregiving and Work in Canada infographic from the Vanier Institute of the Family.
A Snapshot of Workplace Mental Health in Canada

At some point in our lives, we are all affected by mental illness, whether through personal experience or that of a family member, friend, neighbour or colleague. Mental health conditions can have a significant impact on individuals, but they can also “trickle up” to have a detrimental effect on workplaces, communities, the economy and society at large – no one remains untouched. It is therefore vital that support for mental health be multi-faceted and every bit as prevalent as the conditions it seeks to address.
Stigma remains a major barrier to care for those living with a mental illness, many of whom are receiving, and benefiting from, care and support from their families.
This edition of the Vanier Institute of the Family Statistical Snapshots series explores mental health, families and work – three key parts of our lives that intersect and interact in complex ways that affect our well-being.
Highlights include:
- 4 in 10 Canadians have a family member with a mental health problem.
- At least 500,000 employed Canadians are unable to work due to mental health problems in any given week.
- Mental illness accounts for an estimated 30% of all disability claims and 70% of disability costs.
- Stigma remains an issue, with 1 in 5 surveyed Canadian employees saying they believe that whether or not someone becomes mentally ill is “fully within their control.”
- 4 in 10 surveyed Canadian employees say they would not tell their manager if they were experiencing a mental health problem.
- More than 7 in 10 Canadians who are affected by a family member’s mental health problem provided care to them, and 68% say they are not embarrassed about their family member’s mental health condition.
Download A Snapshot of Workplace Mental Health from the Vanier Institute of the Family.
Timeline: Fifty Years of Men, Work and Family in Canada
Over the past half century, fatherhood in Canada has undergone a significant evolution as men are increasingly sharing the “breadwinning” role, embracing caring responsibilities and integrating their responsibilities at home, at work and in their communities.
To explore these trends and the social, economic, cultural and environmental contexts that shape – and are shaped by – fatherhood and family relationships, we’ve created a 50-year timeline for Father’s Day 2016. Some highlights include:
- More fathers are taking time off to care for their newborn children. More than one-quarter (27%) of all recent fathers in Canada reported in 2014 that they took (or intended to take) parental leave, up from only 3% in 2000.
- The number of “stay-at-home” fathers is on the rise. Fathers accounted for approximately 11% of stay-at-home parents in 2014, up from only 1% in 1976.
- Fathers of young children are absent from work more frequently for family-related reasons. Fathers of children under the age of 5 report missing an average 2.0 days of work in 2015 due to personal or family responsibilities, up from 1.2 days in 2009.
- Fewer “lone fathers” are living in low income. In 2008, 7% of persons in lone-parent families headed by men lived in low income, down from 18% in 1976.
- Fathers are increasingly helping with housework. Men who report performing household work devoted an average 184 minutes on these tasks in 2010, up from 171 minutes in 1998.
- Fathers with flex are more satisfied with their work–life balance. More than eight in 10 (81%) full-time working fathers with children under age 18 who have a flexible schedule reported in 2012 being satisfied with their work–life balance, compared with 76% for those without a flexible schedule.
- A growing number of children find it easier to talk to dad. In 2013–2014, 66% of 11-year-old girls and 75% of boys the same age say they find it easy to talk to their father about things that really bother them, up from 56% and 72%, respectively, two decades earlier.
This bilingual resource is a perpetual publication, and it will be updated periodically as new data emerges. Sign up for our monthly e-newsletter to find out about updates, as well as other news about publications, projects and initiatives from the Vanier Institute.
Enjoy our new timeline, and happy Father’s Day to Canada’s 8.6 million dads!
Download the Fifty Years of Men, Work and Family in Canada timeline.
Infographic: Family Diversity in Canada 2016
International Day of Families is approaching on May 15, a special day to recognize the importance of family to communities across the globe. Parents, children, grandparents, great-grandparents, aunts, uncles, siblings, cousins and the friends and neighbours we care for (and who care for us) all make unique and valuable contributions to our lives, our workplaces and our communities.
As we reflect on Canada’s 9.9 million families, one thing that’s clear is that there’s no such thing as a cookie-cutter family. Families are as diverse and unique as the people who comprise them, and they are all an essential part of Canada’s family landscape.
For this year’s International Day of Families, we’ve created an infographic providing a “snapshot” of modern families in Canada that highlights some of the many ways families are diverse:
- 67% of families in Canada are married-couple families, 17% are living common-law, and 16% are lone-parent families – diverse family structures that continuously evolve
- 464,000 stepfamilies live across the country, accounting for 13% of couples with children
- 363,000 households contain three or more generations, and there are also approximately 53,000 “skip-generation” homes (children and grandparents with no middle generation present)
- 1.4 million people in Canada report having an Aboriginal identity (61% First Nations, 32% Métis, 4.2% Inuit, 1.9% other Aboriginal identity, 0.8% more than one Aboriginal identity)
- 360,000 couples in Canada are mixed unions,* accounting for 4.6% of all married and common-law couples
- 65,000 same-sex couples were counted in the 2011 Census, 9.4% of whom are raising children
- 68,000 people in Canada are in the CAF Regular Forces, half of whom have children under 18
As His Excellency The Right Honourable David Johnston, Governor General of Canada, expressed at the Families in Canada Conference 2015, “Families, no matter their background or their makeup, bring new and special patterns to our diverse Canadian tapestry.” Join us as we recognize and celebrate family diversity, from coast to coast to coast.
Download the Family Diversity in Canada 2016 infographic.
* Statistics Canada defines a mixed union as “a couple in which one spouse or partner belongs to a visible minority group and the other does not, as well as a couple in which the two spouses or partners belong to different visible minority groups.”
Timeline: Fifty Years of Women, Work and Family in Canada
While mothers in Canada have always played a central role in family life, there’s no question that the social, economic, cultural and environmental contexts that shape – and are shaped by – motherhood have evolved over time.
A growing share of mothers are managing paid work and family responsibilities compared with previous generations, and the dynamic relationships between women, work and family continue to evolve. To explore these relationships through a broader lens, we’ve created a 50-year timeline for Mother’s Day 2016 that explores some of the long-term trends over the past half century, including:
- An increase in women’s participation in the paid labour force, which has grown from 40% in 1968 to 82% in 2014 for those aged 25 to 54
- A growing share of “breadwinning” moms among single-earner couple families, which has steadily increased from 4% of earners in these families in 1976 to 21% in 2014
- A significant drop in the low-income rate among single mothers, which has fallen from 54% in 1976 to 21% in 2008
- A declining fertility rate, which stood at 3.94 women per children in 1959 during the peak of the baby boom, but has since dropped to 1.61 in 2011
- A continually rising average age of first-time mothers, up from 24.3 years of age in 1974 to 28.5 in 2011
- A greater amount of time mothers are spending with family, with women reporting 421 minutes (7 hours) per day with family in 2010, up from 403 minutes (6.7 hours) in 1986
This bilingual resource is a perpetual publication, and it will be updated periodically as new data emerges. Sign up for our monthly e-newsletter to find out about updates, as well as other news about publications, projects and initiatives from the Vanier Institute.
Enjoy our new timeline, and happy Mother’s Day to Canada’s 9.8 million moms!
Download the Fifty Years of Women, Work and Family in Canada timeline.
Timeline: 50 Years of Families in Canada
Today’s society and today’s families would have been difficult to imagine, let alone understand, a half-century ago.
Families and family life have become increasingly diverse and complex, but families have always been the cornerstone of our society, the engine of our economy and at the centre of our hearts.
Learn about how families and family experiences in Canada have changed over the past 50 years with our new timeline!