
March 22, 2022
Divorce in Canada: A Tale of Two Trends
Nathan Battams shares new findings on divorce trends in Canada over the last 30 years.
March 22, 2022
Nathan Battams
Divorce rates in Canada have fluctuated throughout history, influenced by shifting social, economic, legal, and cultural trends. During the late 1960s to the late 1980s, the number of divorces and the divorce rate increased – fuelled by a mix of interrelated factors, such as declining stigma against divorce, increasing economic independence of women, and major reforms to the Divorce Act in 1968 and 1987 – made it easier to obtain a divorce.
However, a recent release from Statistics Canada shows that, due to a variety of factors, there has been a notable decline in divorce rates and the number of divorces over the last 30 years. This may be better understood as two declines, which overlap, interact, and have distinct drivers and impacts.
Divorce data doesn’t provide a full picture, but what it tells us is important
Statistics on divorce are important because they can provide unique insights on topics at the heart of family life, such as fertility, wealth accumulation, housing, and caregiving – all of which can impact family wellbeing. The statistics don’t provide a complete picture, since 21% of couple relationships were common-law in 2016 – a rate that continues to increase and is much higher in some parts of the country. The dissolution of these couples is not covered in divorce data, nor are separations of married couples.
Nonetheless, divorce data are unique and valuable indicators, since marriages still account for a large majority of couple relationships (79% in 2016), and they are the only available annual statistics on union dissolutions. No official record is kept of the separations, and divorce data don’t capture the dissolution of common-law couples.
Trend 1: Gradual decline in divorce rate from 1991 to 2019
As part of the general population growth, the number of married people in Canada has grown over the past 30 years. Despite this, the number of divorces has fallen considerably, from approximately 79,000 in 1991 to 57,000 by 2019.
As the number of divorces has gradually fallen so has the divorce rate (i.e., the number of persons who divorce in a given year per 1,000 married persons1) – from 12.7 per 1,000 in 1991 to 7.5 per 1,000 in 2019.
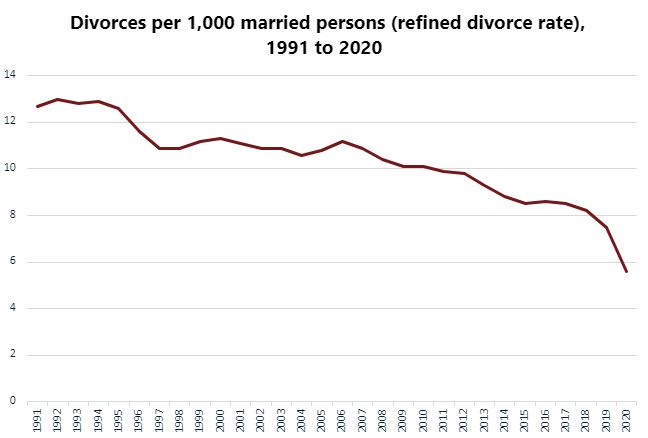
Two main driving factors behind this gradual decline outlined by Statistics Canada are population aging and a lower tendency to divorce among younger married adults today.
As a whole, Canadians who are married have become older during this period, which is partly the result of general population aging in Canada.2 Also, younger generations are increasingly opting for common-law unions instead of getting married. Age-specific divorce rates tend to be relatively lower for older adults: 4.2 per 1,000 for those ages 50 and older in 2020, compared with 7.7 per 1,000 among those under age 50.3 With older adults accounting for a growing share of the married population as younger people choose common-law, these factors converge to push down the divorce rate.
It is important to note, however, that the gap in divorce rates between younger and older generations has shrunk considerably since the mid-2000s. This has been driven by declines among the under-50 age groups, with the largest overall decline among those under 35 (see chart below).
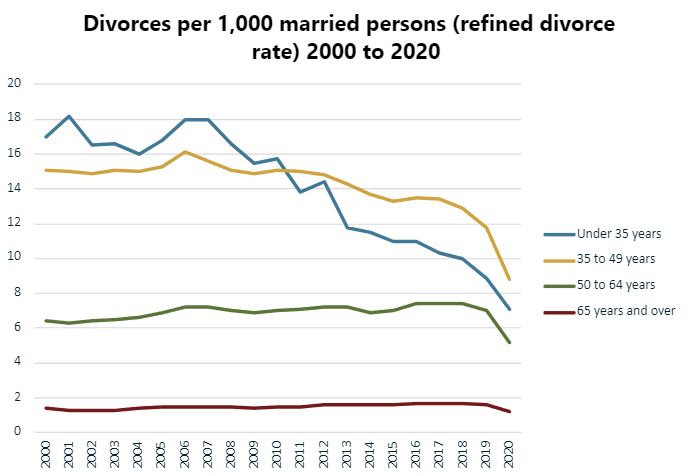
In addition to younger generations seeing the sharpest declines in divorce rates, those who are choosing to marry are doing so at older ages than in the past; the average age at marriage for people who divorced has increased from 23.7 years in 1980 to 30.7 years in 2020.
Trend 2: Sharp decrease in divorce between 2019 and 2020
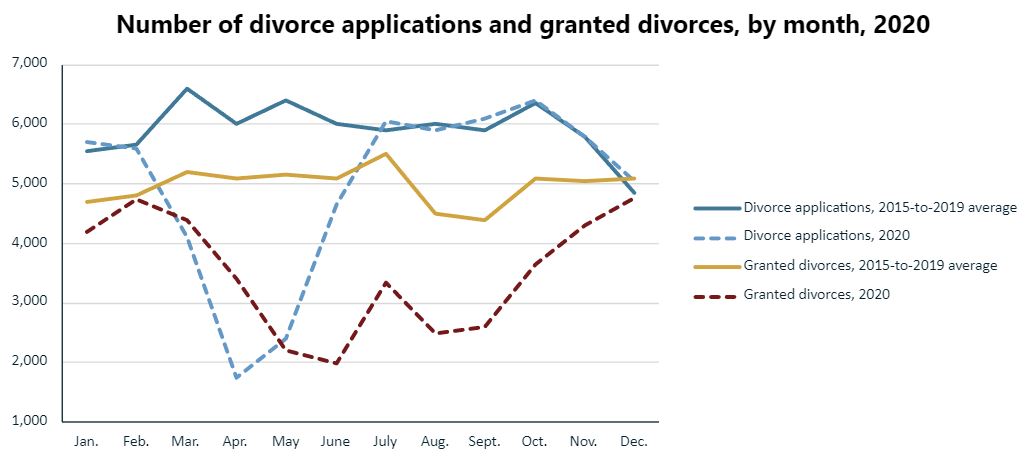
The second decline is more recently concentrated and intense, and results largely from the disruptions and changing accessibility to the services and processes involved with obtaining a divorce during the COVID-19 pandemic. As public health protections were enacted during the onset of the pandemic, court proceedings consequently slowed down, less urgent cases were adjourned, and some courts were temporarily closed.
It was during these early months that there was a major decline in number of divorces, compared with previous years. Nearly 43,000 divorces were granted in Canada in 2020 (the lowest number since 1973), following a record annual decline of 25% from the 57,000 recorded in 2019. Along with the number of divorces, the divorce rate also dropped, from 7.5 per 1,000 married persons in 2019 to 5.6 per 1,000 in 2020.
While the monthly number of divorce applications filed fell sharply beginning in March 2020, the data show that, by July 2020, this number recovered to a level similar to that seen in previous years.
While these represent large shifts in longer-term trends, it is important to note that most of it occurred just within approximately the first four months of the pandemic. The full impact of the pandemic on divorce in Canada is not yet known, because most applications are for “no fault” divorce, which aren’t granted until couples separate for at least one year, and this will only start to show up in not-yet-released 2021 data.
As this is the first time Statistics Canada has published content on divorce using Vital Statistics data in more than a decade, this release provides important and long-sought-after information and insights for those who study families and family life. Continued collection, analysis, and reporting on Vital Statistics data will further clarify and enhance our understanding of these and other family trends.
Nathan Battams is a Knowledge Mobilization Specialist at the Vanier Institute of the Family.
Notes
- This measure is also known as the refined divorce rate or the marital divorce rate. The “married population” in the equation includes those who are separated but still legally married.
- Learn about population aging in Canada in A Snapshot of Population Aging and Intergenerational Relationships in Canada (Vanier Institute of the Family, 2017).
- Statistics Canada. Table 39-10-0053-01. Number of persons who divorced in a given year and divorce rate per 1,000 married persons, by age group and sex or gender.
Stay in the know

InfoVanier
A monthly newsletter of research, resources, and events
Linktree
Get alerts on new Vanier Institute publications, events, and announcements