Kathya Aathavan measures the growing diversity of couple relationships in Canada.
Kathya Aathavan
June 25, 2021
Over the past few decades, couples in Canada have become increasingly diverse. One of the ways this diversity has been measured is by examining mixed unions – marital or common-law unions between two people who cross socially constructed boundaries between groups, such as racial and ethnic identity. This diversity is complex and dynamic, and reflects the larger diversity of Canadian society.
Measuring mixed unions with visible minority status
Since the Census of Canada does not collect information about race directly, past estimates of mixed unions have relied on classifying each partner’s visible minority status. Visible minorities are “persons, other than Aboriginal peoples, who are non-Caucasian in race or non-white in colour” (the status is irrespective of the person’s place of birth).1 In the Census questionnaire, respondents state whether they are or are not a visible minority, and select from the following categories: South Asian, Chinese, Black, Filipino, Latin American, Arab, Southeast Asian, West Asian, Korean, Japanese, Multiple visible minorities, Not a visible minority.2 In 2016, 22% of the population in Canada reported being a visible minority.
Importantly, this measure of visible minority was created for the Employment Equity Act with the purpose of providing equal opportunities in the workplace to specific designated groups, rather than to examine the experiences of racialized individuals in our society. It was never intended to measure diversity but it has been used, due to few alternative data sources available. The most recent Canadian census (2021) also used the concept of visible minority status, though Statistics Canada is exploring alternative ways of measuring population groups for future collection.
When Statistics Canada measures mixed unions, those between “non-visible minorities” and visible minorities are counted as well as those between individuals from different visible minority groups. Using this measure, the reported share of all married or common-law couples that were in mixed unions increased steadily from 2.6% of all unions in 1991, to 3.1% in 2001, 3.9% in 2006 and 4.6% in 2011.3 These estimates show that while the proportion of mixed unions remains relatively low, the percentage that were mixed unions nearly doubled during this two-decade span.
There are important considerations to be taken when using this measure because of the limitations of the concept of visible minority groups on which it relies. One is the classifications of individuals who identify as being white and part of a visible minority group. In some cases, they are counted as a visible minority (i.e. if they report Black and white, they are counted as Black), but in others, they are counted as “Not a visible minority” (i.e. if West Asian and white, counted as not a visible minority). Another way is due to some visible minority categories referring to countries of origin such as Korea or China, while others refer to regions of origin, such as South Asia or Latin America. This is important because this measure relies on individuals being classified under different visible minority groups in order to be counted as being in a mixed union.
Measuring mixed unions with country of origin
In addition to visible minority categories, another important aspect of the racial and ethnic diversity of couples is country of origin, which can determine or shape a person’s social norms and values, culture and language acquisition. Canadians reported 124 different countries as their place of birth in the 2016 Census. Immigration adds diversity to Canadian society at large and to families. Therefore, combining this with visible minority measures can add to our understanding of mixed unions and couple diversity more broadly.
Capturing the diversity of unions with visible minority status and country of origin
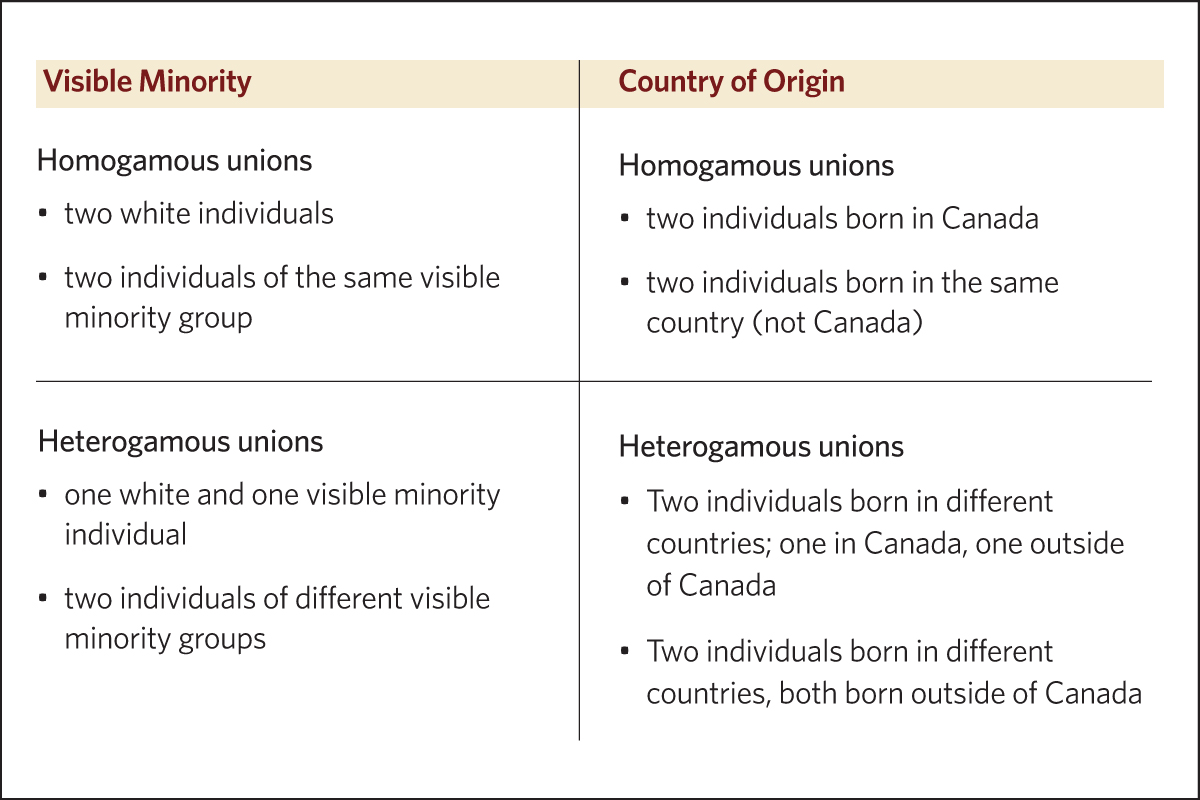
Homogenous (similar) and heterogamous (mixed) unions can be measured in two ways: visible minority and country of origin.
How common are mixed unions now?
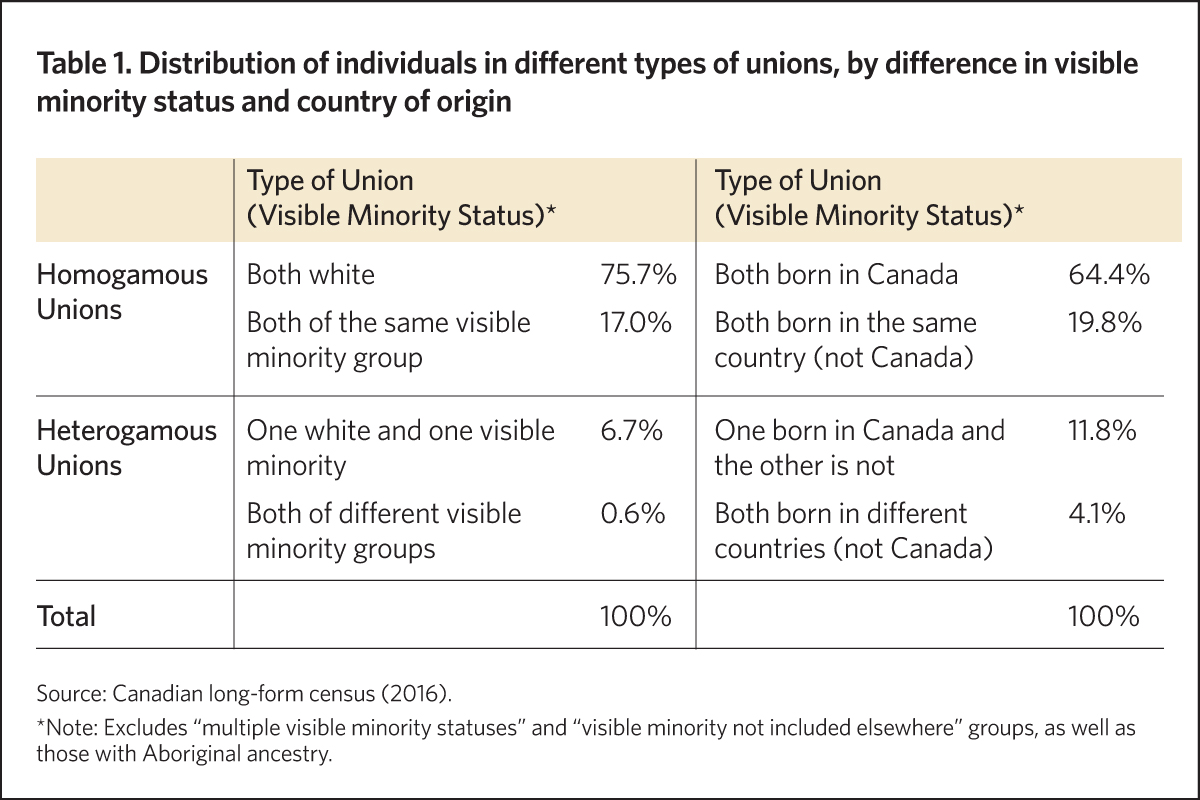
Based on visible minority categories, 7% of all unions in Canada are mixed, with 6.7% being between a white and visible minority group partner, and 0.6% being between partners of different visible minority groups (Table 1).
Based on differences in country of origin, 16% of all couples are in a mixed union where both partners are born in different countries. Approximately one in eight of these couples (12%) include one partner who was born in Canada, and another 4% of couples include two partners born in different countries outside of Canada (Table 1).
Measuring couple diversity with visible minority status does not provide a full picture
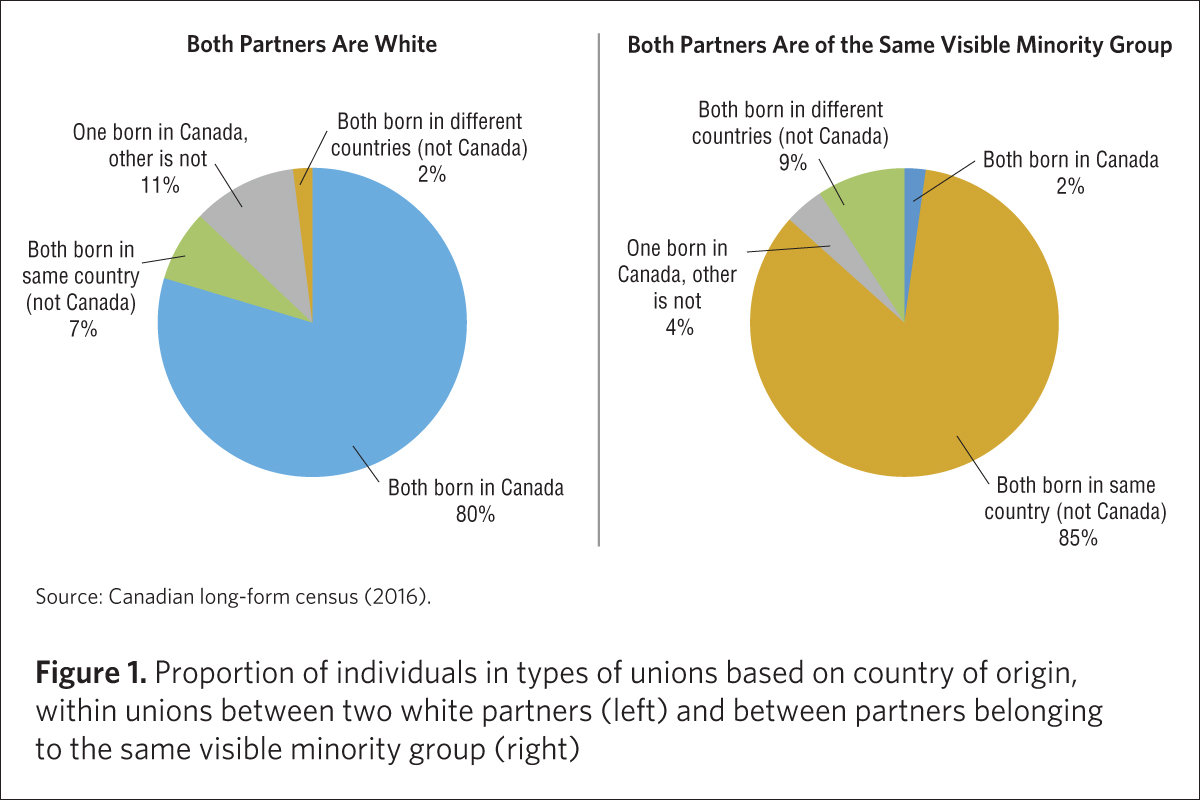
Diversity of unions is underestimated when visible minority status alone is used to measure it. Figure 1 shows the diversity of unions by country of origin for the couples classified as homogamous by visible minority status. In other words, this figure compares the country of origin of couples that are comprised of individuals who are either both white or are both a part of the same visible minority group.
Homogamous white unions make up two-thirds of all married and common-law couples, as seen in Table 1. Among white couples, 20% are made up of a Canadian-born and foreign-born partner, and 13% of them are made up of partners born in different countries, outside of Canada (Figure 1).
Unions where both partners are of the same visible minority group are also disaggregated by the country of origin of individuals in the partnership. These unions make up 17% of all unions (Table 1). In a majority of these couples, both partners were born in the same country outside of Canada, and for 13% of these couples, both partners belong to the same visible minority group but were born in different countries (Figure 1).
Defining mixed unions is a complex and dynamic process
One study that reviewed the research on mixed unions argued that the criteria for identifying mixed unions can impact our understanding of how common they are.4 Instead, they write that “mixed” should be thought of as being on a continuum based on specific characteristics of interest, such as race and ethnicity.
Figure 1 illustrates the complexity of classifying mixed unions. Due to the limitations of how visible minority groups are classified and by only using that as the measure of diversity, some diverse unions are counted, and others are not.
Those who identify as white and are classified as “non-visible minorities” in the data are not a homogenous group. For example, an Italian-Greek couple may not have to navigate differences in racial identity but may have similar experiences in navigating cultural differences within the relationship as those in mixed unions across some visible minority groups.
The categorization of visible minority categories by the Employment Equity Act is also not straightforward. Although some categories refer to those living in Canada who immigrated or whose ancestors immigrated from a particular country (categories such as “Japanese” or “Filipino”), others refer to broader regions (categories such as “South Asian” or “Latin American”). This further demonstrates that these measures are just one way of capturing some of the ethnic and racial diversity within partnerships.
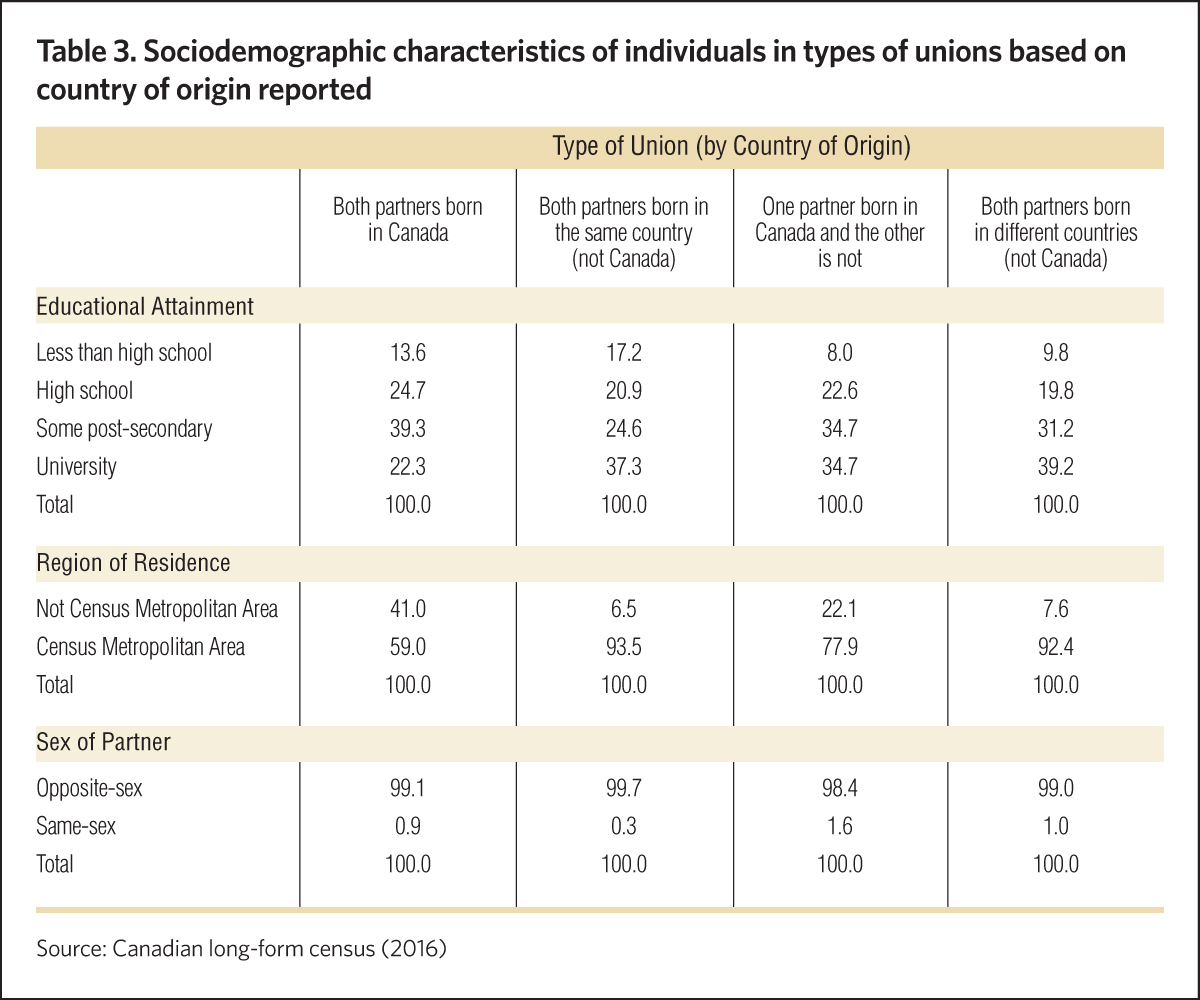
Mixed unions more common among urban, highly educated people and same-sex partners
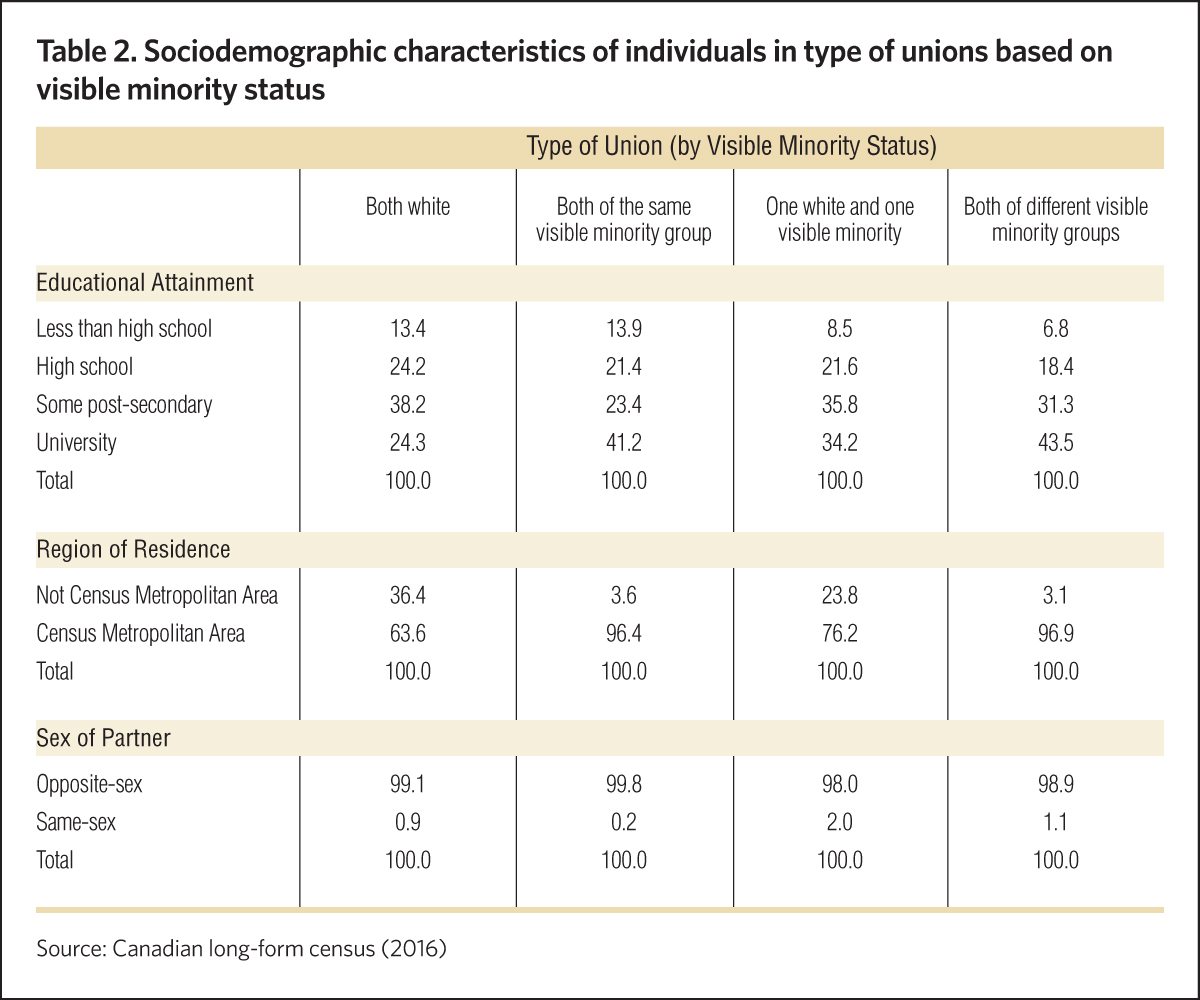
Mixed couples live in cities, have university degrees and have same-sex partners in higher proportions than their non-mixed counterparts by both measures.
In comparison with couples where both are white, higher proportions of mixed couples have university degrees (Table 2). Just over three-quarters of couples (76%) comprised of one white and one visible minority partner and 97% of couples made up of different visible minority group partners live in big cities, compared with 64% of couples where both are white. Moreover, a slightly larger percentage of mixed couples are also in same-sex unions compared with homogamous white couples.
The patterns are similar for mixed couples by country of origin (Table 3). In comparison with couples where both are born in Canada, a higher percentage of mixed couples have university degrees, live in big cities, and have same-sex partners. These patterns hold true even when the differences between these couples in age are taken into account.
Increasing couple diversity reflects broader diversity in Canada
Possible explanations for these patterns include increasing physical and social opportunities to meet people of different backgrounds and changing preferences about who can marry whom. Certain subpopulations may experience more of those opportunities. Those who are urban, highly educated and in same-sex partnerships, for example, may have more access to integrated and diverse neighbourhoods, schools and workplaces.5 Song and Qian note the importance of examining class differences in who has access to these diverse spaces and partnering across ethnic and racial boundaries.6
Although the increase in mixed coupling on its own is not an indicator of social change or acceptance of minority groups, it is made possible by the increasing diversity in Canada.
Kathya Aathavan, MA, is a graduate from the department of sociology at the University of Western Ontario, interested in research on family, migration and demography.
Notes
- Statistics Canada, “Mixed Unions in Canada,” Report (2014). Link: https://bit.ly/3h0TBDB.
- Those reporting “aboriginal ancestry” are not considered a visible minority.
- Statistics Canada (2014).
- Sayaka Osanami Törngren, Nahikari Irastorza and Miri Song. “Toward Building a Conceptual Framework on Intermarriage,” Ethnicities 16(4) (2016). Link: https://bit.ly/3d6qFrh.
- Zhenchao Qian and Daniel T. Lichter, “Changing Patterns of Interracial Marriage in a Multiracial Society,” Journal of Marriage and Family, 73(5) (2011): 1065-1084. Link: https://bit.ly/3x2JpQx; Michael J. Rosenfeld and Byung-Soo Kim, “The Independence of Young Adults and the Rise of Interracial and Same-Sex Unions,” American Sociological Review, 70(4) (2005): 541-562. Link: https://bit.ly/35UTJOH; Richard Wright, et al., “Crossing Racial Lines: Geographies of Mixed-Race Partnering and Multiraciality in the United States,” Progress in Human Geography, 27(4) (2003): 457-474. Link: https://bit.ly/3qDQyEA.
- Miri Song, “Is Intermarriage a Good Indicator of Integration?,” Journal of Ethnic and Migration Studies, 35(2) (2009): 331-348. Link: https://bit.ly/2SyiywL; Zhenchao Qian, “Breaking the Last Taboo: Interracial Marriage in America,” Contexts, 4(4) (2005): 33-37. Link: https://bit.ly/3w03rtx.